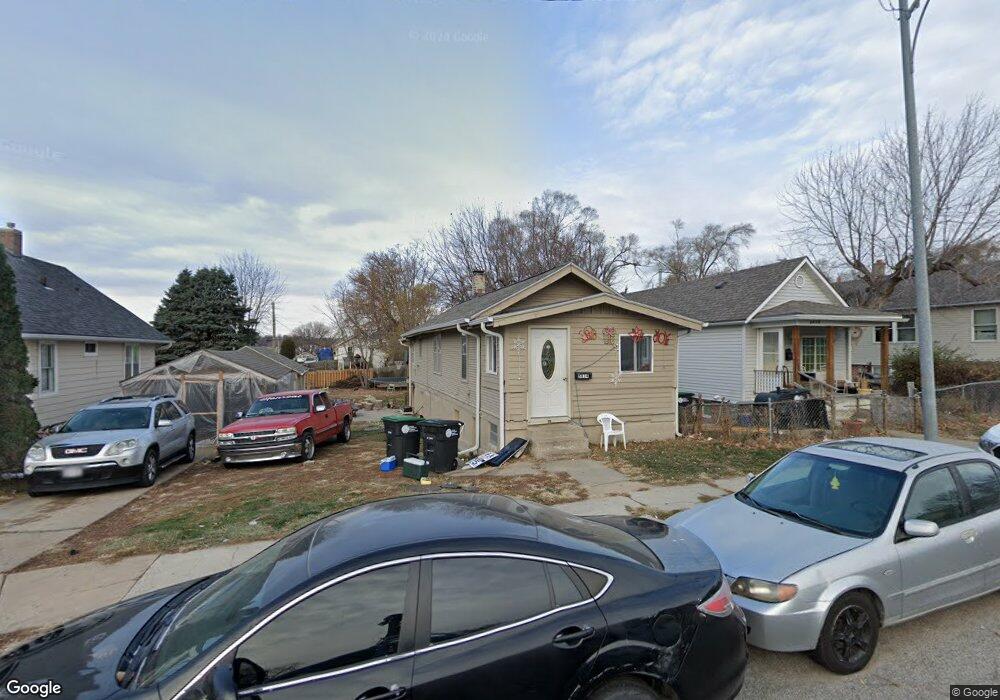
5814 S 21st St Omaha, NE 68107
Brown Park NeighborhoodEstimated Value: $93,000 - $179,000
2
Beds
2
Baths
1,120
Sq Ft
$129/Sq Ft
Est. Value
About This Home
This home is located at 5814 S 21st St, Omaha, NE 68107 and is currently estimated at $144,285, approximately $128 per square foot. 5814 S 21st St is a home located in Douglas County with nearby schools including R.M. Marrs Magnet Middle School, South High Magnet School, and Assumption-Guadalupe School.
Ownership History
Date
Name
Owned For
Owner Type
Purchase Details
Closed on
Dec 16, 2019
Sold by
Chaidez Jubentino and Chaidez Delfina
Bought by
Paramo Jose Monreal and Gonzalez Aguilar Luz
Current Estimated Value
Purchase Details
Closed on
Mar 21, 2016
Sold by
Hernandez Rosa
Bought by
Chaidez Jubentino and Chaidez Delfina
Home Financials for this Owner
Home Financials are based on the most recent Mortgage that was taken out on this home.
Original Mortgage
$4,400
Interest Rate
3.72%
Mortgage Type
New Conventional
Create a Home Valuation Report for This Property
The Home Valuation Report is an in-depth analysis detailing your home's value as well as a comparison with similar homes in the area
Home Values in the Area
Average Home Value in this Area
Purchase History
| Date | Buyer | Sale Price | Title Company |
|---|---|---|---|
| Paramo Jose Monreal | $82,000 | None Available | |
| Chaidez Jubentino | $50,000 | None Available |
Source: Public Records
Mortgage History
| Date | Status | Borrower | Loan Amount |
|---|---|---|---|
| Previous Owner | Chaidez Jubentino | $4,400 |
Source: Public Records
Tax History Compared to Growth
Tax History
| Year | Tax Paid | Tax Assessment Tax Assessment Total Assessment is a certain percentage of the fair market value that is determined by local assessors to be the total taxable value of land and additions on the property. | Land | Improvement |
|---|---|---|---|---|
| 2025 | $1,785 | $139,600 | $12,600 | $127,000 |
| 2024 | $2,329 | $110,400 | $12,600 | $97,800 |
| 2023 | $2,329 | $110,400 | $12,600 | $97,800 |
| 2022 | $1,878 | $88,000 | $8,800 | $79,200 |
| 2021 | $1,863 | $88,000 | $8,800 | $79,200 |
| 2020 | $1,743 | $81,400 | $8,800 | $72,600 |
| 2019 | $1,402 | $65,300 | $8,800 | $56,500 |
| 2018 | $1,398 | $65,000 | $8,800 | $56,200 |
| 2017 | $1,082 | $64,000 | $7,800 | $56,200 |
| 2016 | $1,082 | $50,400 | $4,900 | $45,500 |
| 2015 | $1,067 | $50,400 | $4,900 | $45,500 |
| 2014 | $1,067 | $50,400 | $4,900 | $45,500 |
Source: Public Records
Map
Nearby Homes