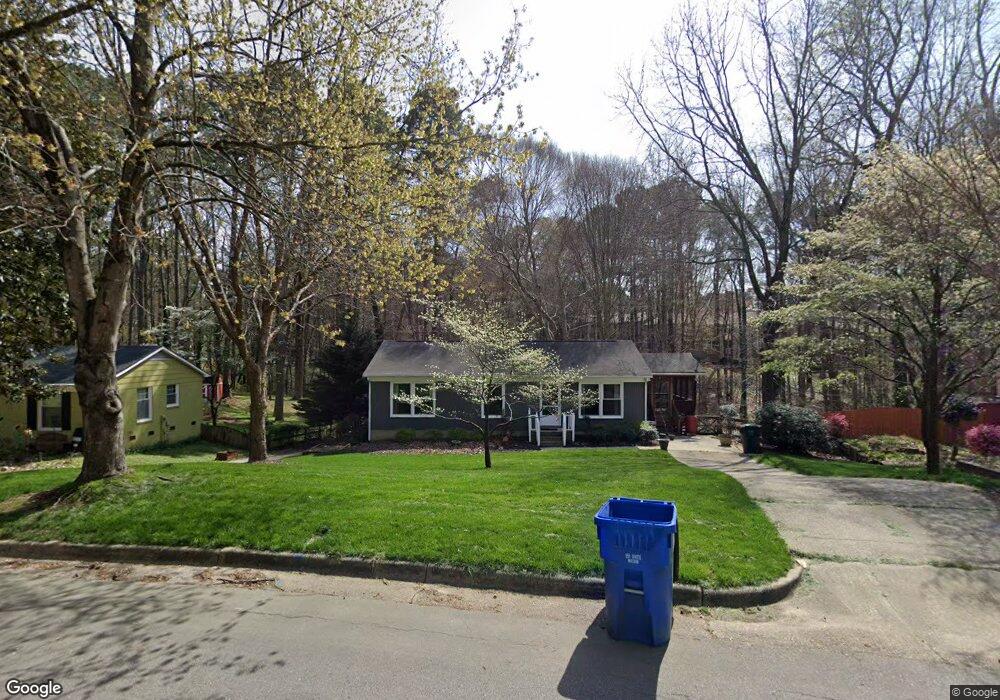
5816 Caledonia St Raleigh, NC 27609
North Hills NeighborhoodEstimated Value: $467,000 - $508,000
3
Beds
3
Baths
1,830
Sq Ft
$264/Sq Ft
Est. Value
About This Home
This home is located at 5816 Caledonia St, Raleigh, NC 27609 and is currently estimated at $483,864, approximately $264 per square foot. 5816 Caledonia St is a home located in Wake County with nearby schools including Green Elementary, Carroll Middle, and Sanderson High School.
Ownership History
Date
Name
Owned For
Owner Type
Purchase Details
Closed on
May 14, 2015
Sold by
Haz Charlie S and Cole Cathy Lynn
Bought by
Downing Keith
Current Estimated Value
Home Financials for this Owner
Home Financials are based on the most recent Mortgage that was taken out on this home.
Original Mortgage
$217,979
Outstanding Balance
$168,349
Interest Rate
3.75%
Mortgage Type
FHA
Estimated Equity
$315,515
Purchase Details
Closed on
Mar 14, 2014
Sold by
Grooters Jason W and Grooters Jenifer L
Bought by
Middleton Brandon J and Haz Charlie S
Home Financials for this Owner
Home Financials are based on the most recent Mortgage that was taken out on this home.
Original Mortgage
$178,500
Interest Rate
4.3%
Mortgage Type
New Conventional
Purchase Details
Closed on
Jul 30, 2003
Sold by
Krebs Paul H and Krebs Barbara I
Bought by
Grooters Jason W and Grooters Jenifer L
Home Financials for this Owner
Home Financials are based on the most recent Mortgage that was taken out on this home.
Original Mortgage
$122,400
Interest Rate
5.17%
Mortgage Type
Balloon
Create a Home Valuation Report for This Property
The Home Valuation Report is an in-depth analysis detailing your home's value as well as a comparison with similar homes in the area
Home Values in the Area
Average Home Value in this Area
Purchase History
| Date | Buyer | Sale Price | Title Company |
|---|---|---|---|
| Downing Keith | $222,000 | None Available | |
| Middleton Brandon J | $210,000 | None Available | |
| Grooters Jason W | $153,000 | -- |
Source: Public Records
Mortgage History
| Date | Status | Borrower | Loan Amount |
|---|---|---|---|
| Open | Downing Keith | $217,979 | |
| Closed | Middleton Brandon J | $178,500 | |
| Previous Owner | Grooters Jason W | $122,400 |
Source: Public Records
Tax History Compared to Growth
Tax History
| Year | Tax Paid | Tax Assessment Tax Assessment Total Assessment is a certain percentage of the fair market value that is determined by local assessors to be the total taxable value of land and additions on the property. | Land | Improvement |
|---|---|---|---|---|
| 2025 | $3,597 | $410,139 | $210,000 | $200,139 |
| 2024 | $3,582 | $410,139 | $210,000 | $200,139 |
| 2023 | $3,033 | $276,446 | $110,000 | $166,446 |
| 2022 | $2,819 | $276,446 | $110,000 | $166,446 |
| 2021 | $2,710 | $276,446 | $110,000 | $166,446 |
| 2020 | $2,661 | $276,446 | $110,000 | $166,446 |
| 2019 | $2,527 | $216,333 | $75,000 | $141,333 |
| 2018 | $2,384 | $216,333 | $75,000 | $141,333 |
| 2017 | $2,271 | $216,333 | $75,000 | $141,333 |
| 2016 | $2,224 | $216,333 | $75,000 | $141,333 |
| 2015 | $2,037 | $194,778 | $72,000 | $122,778 |
| 2014 | $1,932 | $194,778 | $72,000 | $122,778 |
Source: Public Records
Map
Nearby Homes
- 821 Northclift Dr
- 6016 Dixon Dr
- 6025 Dixon Dr
- 6404 Dixon Dr
- 5961 Dixon Dr
- 6025 Bellow St
- 6125 Bellow St
- 1302 Springlawn Ct
- 5705 Parker Pines Ct
- 801 Genford Ct
- 5631 Johnson Woods Ct
- 5706 Parker Pines Ct
- 1375 Garden Crest Cir
- 6001 Whittier Dr
- 6628 Lynndale Dr
- 813 Mill Greens Ct
- 6608 Orford Ct
- 7101 Summerland Dr
- 7271 Shellburne Dr
- 911 Temple St
- 5820 Caledonia St
- 5812 Caledonia St
- 5824 Caledonia St
- 5813 Caledonia St
- 5808 Caledonia St
- 5817 Caledonia St
- 6005 Ballou Ct
- 5809 Caledonia St
- 5804 Caledonia St
- 6009 Ballou Ct
- 6101 Ballou Ct
- 6214 Dixon Dr
- 6212 Dixon Dr
- 6105 Ballou Ct
- 5805 Caledonia St
- 6210 Dixon Dr
- 6208 Dixon Dr
- 6206 Dixon Dr
- 6001 Ballou Ct
- 6204 Dixon Dr