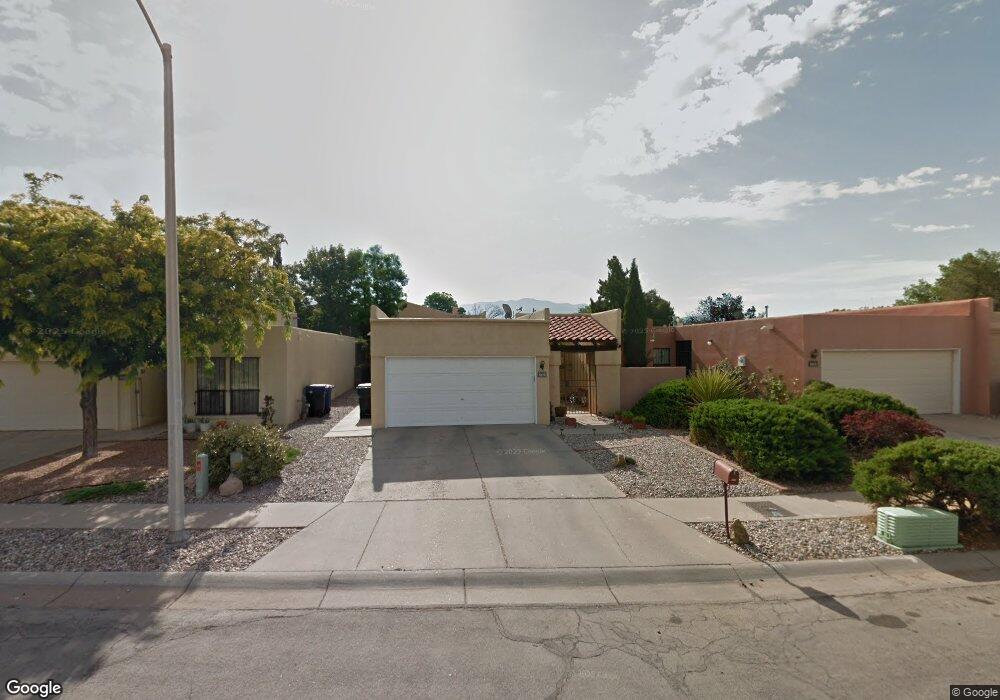
5816 Elmwood Dr NE Albuquerque, NM 87109
Bear Canyon NeighborhoodEstimated Value: $275,000 - $303,000
2
Beds
2
Baths
1,250
Sq Ft
$226/Sq Ft
Est. Value
About This Home
This home is located at 5816 Elmwood Dr NE, Albuquerque, NM 87109 and is currently estimated at $282,120, approximately $225 per square foot. 5816 Elmwood Dr NE is a home located in Bernalillo County with nearby schools including Arroyo Del Oso Elementary School, Cleveland Middle School, and Del Norte High School.
Ownership History
Date
Name
Owned For
Owner Type
Purchase Details
Closed on
Jul 18, 2003
Sold by
Wiegers John
Bought by
Wiegers Lisa
Current Estimated Value
Home Financials for this Owner
Home Financials are based on the most recent Mortgage that was taken out on this home.
Original Mortgage
$101,500
Outstanding Balance
$42,554
Interest Rate
5.19%
Mortgage Type
Purchase Money Mortgage
Estimated Equity
$239,566
Purchase Details
Closed on
Jul 22, 1999
Sold by
Wiegers Lisa
Bought by
Wiegers John
Home Financials for this Owner
Home Financials are based on the most recent Mortgage that was taken out on this home.
Original Mortgage
$103,500
Interest Rate
7.39%
Purchase Details
Closed on
Jul 16, 1999
Sold by
Dossey Jame L
Bought by
Wiegers Lisa M
Home Financials for this Owner
Home Financials are based on the most recent Mortgage that was taken out on this home.
Original Mortgage
$103,500
Interest Rate
7.39%
Create a Home Valuation Report for This Property
The Home Valuation Report is an in-depth analysis detailing your home's value as well as a comparison with similar homes in the area
Home Values in the Area
Average Home Value in this Area
Purchase History
| Date | Buyer | Sale Price | Title Company |
|---|---|---|---|
| Wiegers Lisa | -- | Rio Grande Title Company Inc | |
| Wiegers John | -- | -- | |
| Wiegers Lisa | -- | -- | |
| Wiegers Lisa M | -- | Albuquerque Title Co Inc |
Source: Public Records
Mortgage History
| Date | Status | Borrower | Loan Amount |
|---|---|---|---|
| Open | Wiegers Lisa | $101,500 | |
| Closed | Wiegers Lisa M | $103,500 |
Source: Public Records
Tax History Compared to Growth
Tax History
| Year | Tax Paid | Tax Assessment Tax Assessment Total Assessment is a certain percentage of the fair market value that is determined by local assessors to be the total taxable value of land and additions on the property. | Land | Improvement |
|---|---|---|---|---|
| 2025 | $2,431 | $59,348 | $14,682 | $44,666 |
| 2024 | $2,431 | $57,620 | $14,255 | $43,365 |
| 2023 | $2,391 | $55,942 | $13,840 | $42,102 |
| 2022 | $2,310 | $54,313 | $13,437 | $40,876 |
| 2021 | $2,232 | $52,730 | $13,045 | $39,685 |
| 2020 | $2,196 | $51,194 | $12,665 | $38,529 |
| 2019 | $2,160 | $50,375 | $14,758 | $35,617 |
| 2018 | $2,083 | $50,375 | $14,758 | $35,617 |
| 2017 | $2,019 | $48,909 | $14,329 | $34,580 |
| 2016 | $1,961 | $46,101 | $13,506 | $32,595 |
| 2015 | $44,759 | $44,759 | $13,113 | $31,646 |
| 2014 | $1,845 | $43,456 | $12,731 | $30,725 |
| 2013 | -- | $42,191 | $12,361 | $29,830 |
Source: Public Records
Map
Nearby Homes
- 5813 Elmwood Dr NE
- 66 Calle de La Noche NE
- 51 Calle San Blas NE
- 49 Calle San Blas NE
- 20 Plaza Olas Altos NE
- 106 Calle Playa Del Sol NE
- 6116 Dungan St NE
- 6800 Orphelia Ave NE
- 6700 Esther Ave NE
- 6104 Osuna Rd NE
- 6800 Esther Ave NE
- 5125 Pinata Place NE
- 6904 Esther Ave NE
- 6127 Downey St NE
- 6900 Marilyn Ave NE
- 6221 Truchas Dr NE
- 6105 Mcleod Rd NE
- 6505 Mckinney Dr NE
- 6917 Marilyn Ave NE
- 7428 Gila Rd NE
- 5812 Elmwood Dr NE
- 5820 Elmwood Dr NE
- 5808 Elmwood Dr NE
- 5824 Elmwood Dr NE
- 5828 Elmwood Dr NE
- 5800 Elmwood Dr NE
- 5815 Knollwood Dr NE
- 5823 Knollwood Dr NE
- 5819 Knollwood Dr NE
- 5811 Knollwood Dr NE
- 5827 Knollwood Dr NE
- 5801 Knollwood Dr NE
- 5832 Elmwood Dr NE
- 5831 Knollwood Dr NE
- 5809 Elmwood Dr NE
- 5823 Elmwood Dr NE
- 5827 Elmwood Dr NE
- 5835 Knollwood Dr NE
- 5805 Elmwood Dr NE
- 5836 Elmwood Dr NE