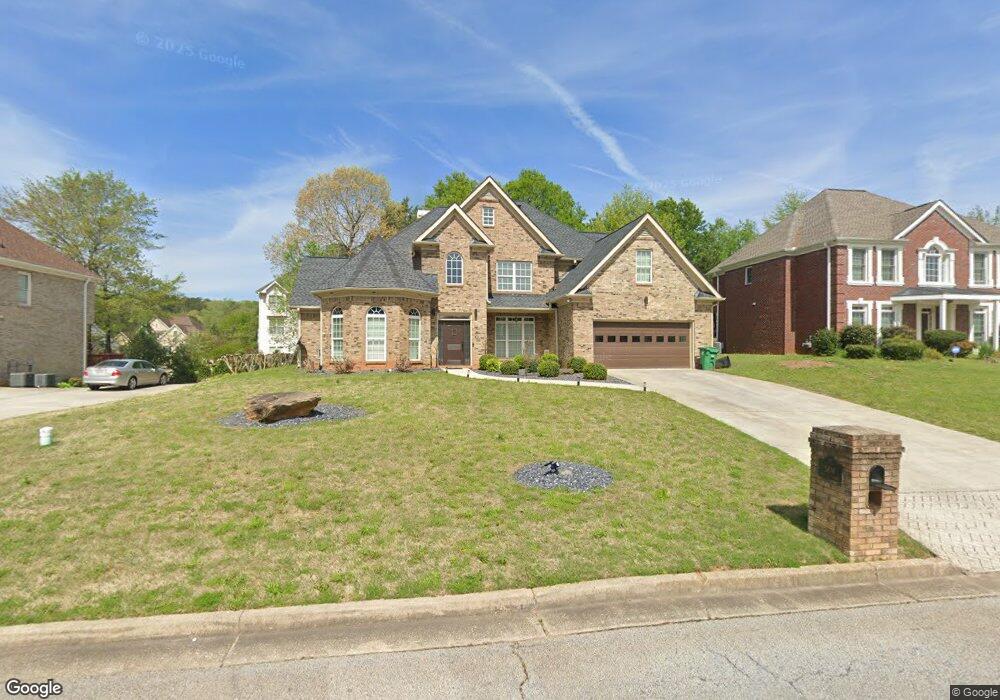
5816 Old Mill Trace Lithonia, GA 30038
Estimated Value: $325,000 - $435,000
4
Beds
3
Baths
3,531
Sq Ft
$104/Sq Ft
Est. Value
About This Home
This home is located at 5816 Old Mill Trace, Lithonia, GA 30038 and is currently estimated at $366,293, approximately $103 per square foot. 5816 Old Mill Trace is a home located in DeKalb County with nearby schools including Flat Rock Elementary School, Salem Middle School, and Martin Luther King- Jr. High School.
Ownership History
Date
Name
Owned For
Owner Type
Purchase Details
Closed on
Nov 12, 2008
Sold by
Residential Fndg Co Llc
Bought by
Williams Jamal K
Current Estimated Value
Home Financials for this Owner
Home Financials are based on the most recent Mortgage that was taken out on this home.
Original Mortgage
$189,499
Outstanding Balance
$122,700
Interest Rate
5.89%
Mortgage Type
FHA
Estimated Equity
$243,593
Purchase Details
Closed on
May 30, 2006
Sold by
Reed Tiea
Bought by
Scale Stephanie
Home Financials for this Owner
Home Financials are based on the most recent Mortgage that was taken out on this home.
Original Mortgage
$319,200
Interest Rate
8.62%
Mortgage Type
New Conventional
Purchase Details
Closed on
Sep 20, 2005
Sold by
Global Professional Developmen
Bought by
Reed Tiea
Home Financials for this Owner
Home Financials are based on the most recent Mortgage that was taken out on this home.
Original Mortgage
$264,000
Interest Rate
5.86%
Mortgage Type
New Conventional
Create a Home Valuation Report for This Property
The Home Valuation Report is an in-depth analysis detailing your home's value as well as a comparison with similar homes in the area
Home Values in the Area
Average Home Value in this Area
Purchase History
We collect this data history from publicly available records. To have your information removed, we recommend requesting removal directly through your county’s website.
| Date | Buyer | Sale Price | Title Company |
|---|---|---|---|
| Williams Jamal K | $192,000 | -- | |
| Scale Stephanie | $399,000 | -- | |
| Reed Tiea | $57,000 | -- |
Source: Public Records
Mortgage History
We collect this data history from publicly available records. To have your information removed, we recommend requesting removal directly through your county’s website.
| Date | Status | Borrower | Loan Amount |
|---|---|---|---|
| Open | Williams Jamal K | $189,499 | |
| Previous Owner | Scale Stephanie | $319,200 | |
| Previous Owner | Reed Tiea | $264,000 |
Source: Public Records
Tax History
| Year | Tax Paid | Tax Assessment Tax Assessment Total Assessment is a certain percentage of the fair market value that is determined by local assessors to be the total taxable value of land and additions on the property. | Land | Improvement |
|---|---|---|---|---|
| 2025 | $4,486 | $153,800 | $26,960 | $126,840 |
| 2024 | $4,411 | $145,560 | $26,960 | $118,600 |
| 2023 | $4,411 | $143,640 | $26,960 | $116,680 |
| 2022 | $3,449 | $108,280 | $26,960 | $81,320 |
| 2021 | $3,072 | $90,880 | $26,960 | $63,920 |
| 2020 | $3,044 | $90,960 | $26,960 | $64,000 |
| 2019 | $3,129 | $92,520 | $26,960 | $65,560 |
| 2018 | $2,667 | $80,800 | $26,960 | $53,840 |
| 2017 | $2,660 | $76,000 | $26,960 | $49,040 |
| 2016 | $2,804 | $82,080 | $26,960 | $55,120 |
| 2014 | $2,032 | $60,080 | $26,920 | $33,160 |
Source: Public Records
Map
Nearby Homes
- 5806 Windermere Ct
- 5770 Southcrest Ln
- 4218 Flat Rock Rd
- 5681 Winchester Place
- 4046 Crossvale Rd
- 4247 Sawgrass Dr
- 5453 Flat Rock Point
- 7116 Browns Mill Rd
- 4206 W Flat Rock Dr
- 5454 Flat Rock Point
- 5624 Browns Mill Rd
- 4131 Spencer Ln
- 4077 Agnes Cir
- 5400 Andrew Ln
- 5728 Salem Rd
- 5757 Fieldstone Dr
- 5440 Browns Mill
- 4230 Sandstone Shores Dr
- 4230 Sandstone Shores Dr Unit 38
- 6378 Browns Mill Rd
- 5822 Old Mill Trace
- 4048 Brooks Mill Dr
- 4042 Brooks Mill Dr
- 5828 Old Mill Trace
- 5804 Old Mill Trace
- 5815 Old Mill Trace
- 5821 Old Mill Trace
- 4036 Brooks Mill Dr
- 5809 Old Mill Trace
- 5827 Old Mill Trace
- 4054 Brooks Mill Dr
- 5834 Old Mill Trace
- 5803 Old Mill Trace
- 4030 Brooks Mill Dr
- 5796 Old Mill Trace
- 5833 Old Mill Trace
- 5818 Mill Crest Way
- 5812 Mill Crest Way
- 4045 Brooks Mill Dr
- 4051 Brooks Mill Dr
Your Personal Tour Guide
Ask me questions while you tour the home.