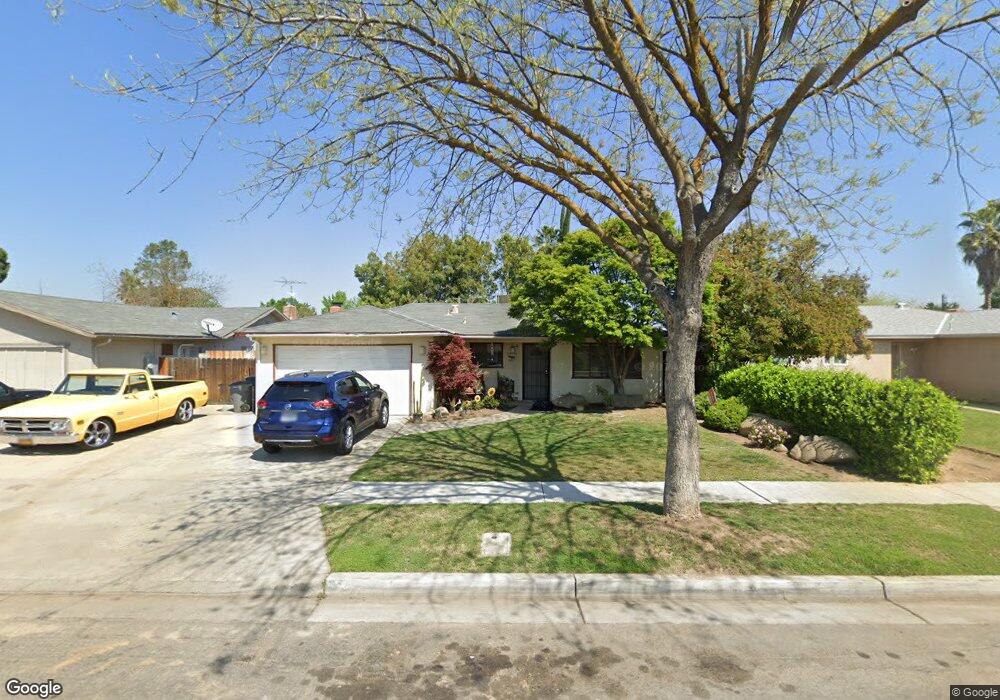
5817 E Saginaw Way Fresno, CA 93727
McLane NeighborhoodEstimated Value: $356,122 - $396,000
3
Beds
2
Baths
1,204
Sq Ft
$310/Sq Ft
Est. Value
About This Home
This home is located at 5817 E Saginaw Way, Fresno, CA 93727 and is currently estimated at $373,031, approximately $309 per square foot. 5817 E Saginaw Way is a home located in Fresno County with nearby schools including Tomahawk School, Miramonte Elementary School, and Reyburn Intermediate School.
Ownership History
Date
Name
Owned For
Owner Type
Purchase Details
Closed on
Sep 29, 2005
Sold by
Tfs Investments Llc
Bought by
Jones Drone E and Jones Candace E
Current Estimated Value
Home Financials for this Owner
Home Financials are based on the most recent Mortgage that was taken out on this home.
Original Mortgage
$125,650
Outstanding Balance
$67,084
Interest Rate
5.72%
Mortgage Type
Fannie Mae Freddie Mac
Estimated Equity
$305,947
Purchase Details
Closed on
May 26, 2005
Sold by
Calasset Llc
Bought by
Tfs Investments Llc
Purchase Details
Closed on
Feb 7, 2005
Sold by
Calasset Llc
Bought by
Calasset Llc
Purchase Details
Closed on
Jan 21, 2005
Sold by
Mendoza Gilbert and Mendoza Alicia G
Bought by
Cal Asset Llc
Purchase Details
Closed on
Feb 15, 1995
Sold by
Va
Bought by
Mendoza Gilbert and Mendoza Alicia G
Create a Home Valuation Report for This Property
The Home Valuation Report is an in-depth analysis detailing your home's value as well as a comparison with similar homes in the area
Home Values in the Area
Average Home Value in this Area
Purchase History
| Date | Buyer | Sale Price | Title Company |
|---|---|---|---|
| Jones Drone E | $251,500 | Fidelity National Title Co | |
| Tfs Investments Llc | -- | Fidelity National Title Co | |
| Calasset Llc | -- | -- | |
| Cal Asset Llc | $182,525 | -- | |
| Mendoza Gilbert | -- | Chicago Title |
Source: Public Records
Mortgage History
| Date | Status | Borrower | Loan Amount |
|---|---|---|---|
| Open | Jones Drone E | $125,650 | |
| Closed | Mendoza Gilbert | $0 |
Source: Public Records
Tax History Compared to Growth
Tax History
| Year | Tax Paid | Tax Assessment Tax Assessment Total Assessment is a certain percentage of the fair market value that is determined by local assessors to be the total taxable value of land and additions on the property. | Land | Improvement |
|---|---|---|---|---|
| 2025 | $3,924 | $323,200 | $100,400 | $222,800 |
| 2023 | $3,548 | $291,800 | $90,700 | $201,100 |
| 2022 | $3,435 | $280,700 | $87,300 | $193,400 |
| 2021 | $2,842 | $234,000 | $72,800 | $161,200 |
| 2020 | $2,557 | $209,000 | $65,000 | $144,000 |
| 2019 | $2,403 | $196,300 | $43,600 | $152,700 |
| 2018 | $2,352 | $192,600 | $42,800 | $149,800 |
| 2017 | $2,205 | $180,000 | $40,000 | $140,000 |
| 2016 | $1,939 | $160,400 | $39,900 | $120,500 |
| 2015 | $1,750 | $144,600 | $36,000 | $108,600 |
| 2014 | $1,643 | $135,500 | $33,800 | $101,700 |
Source: Public Records
Map
Nearby Homes
- 3556 N Duke Ave Unit 165
- 3624 Eddy Ave
- 5936 E Lansing Way
- 3605 Phillip Ave
- 3550 N Duke Ave Unit 37
- 3550 N Duke Ave Unit 10
- 3550 N Duke Ave Unit 12
- 3734 Manila Ave
- 5934 E Dakota Ave
- 5739 E Hampton Way
- 4065 N Eddy Ave
- 5703 E Hampton Way
- 6008 E Sussex Way
- 5675 E Ashlan Ave
- 1424 Tarpey Dr
- 6402 E Millie Dr
- 3322 N Ezie Ave
- 5658 E Bernadine Dr
- 1717 Swift Ave
- 5965 E Shields Ave Unit 178
- 5821 E Saginaw Way
- 5813 E Saginaw Way
- 5818 E Pontiac Way
- 5827 E Saginaw Way
- 5822 E Pontiac Way
- 5814 E Pontiac Way
- 5828 E Pontiac Way
- 5816 E Saginaw Way
- 5812 E Saginaw Way
- 5820 E Saginaw Way
- 5831 E Saginaw Way
- 3895 N Claremont Ave
- 5826 E Saginaw Way
- 5832 E Pontiac Way
- 3885 N Claremont Ave
- 3907 N Claremont Ave
- 3877 N Claremont Ave
- 3917 N Claremont Ave
- 5830 E Saginaw Way
- 5836 E Pontiac Way