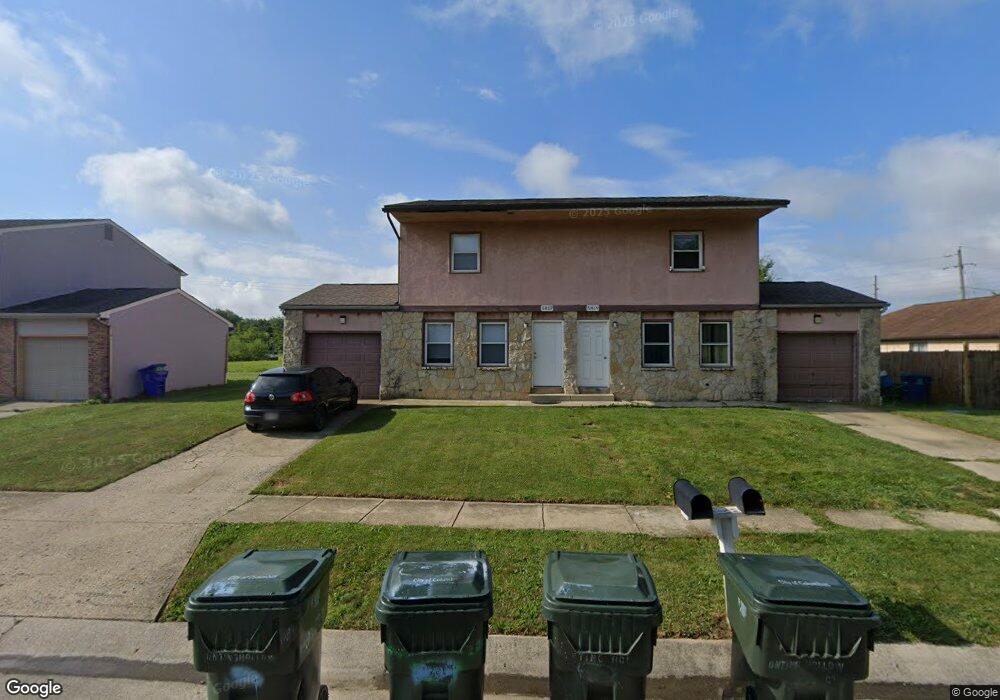
5817 Hunting Hollow Ct Galloway, OH 43119
Westchester-Green Countrie NeighborhoodEstimated Value: $316,000 - $337,000
4
Beds
4
Baths
2,016
Sq Ft
$162/Sq Ft
Est. Value
About This Home
This home is located at 5817 Hunting Hollow Ct, Galloway, OH 43119 and is currently estimated at $325,901, approximately $161 per square foot. 5817 Hunting Hollow Ct is a home located in Franklin County with nearby schools including Darby Woods Elementary School, Galloway Ridge Intermediate School, and Pleasant View Middle School.
Ownership History
Date
Name
Owned For
Owner Type
Purchase Details
Closed on
Jul 31, 2024
Sold by
Glandon Jeffrey A
Bought by
Ikon Properties Llc
Current Estimated Value
Purchase Details
Closed on
Apr 24, 2006
Sold by
Lelko John H
Bought by
Glandon Jeffrey A
Purchase Details
Closed on
Nov 20, 2001
Sold by
Moore Richard M
Bought by
Lelko John H
Home Financials for this Owner
Home Financials are based on the most recent Mortgage that was taken out on this home.
Original Mortgage
$92,400
Interest Rate
6.68%
Mortgage Type
Purchase Money Mortgage
Purchase Details
Closed on
Nov 24, 1999
Sold by
Hucklew Daniel F and Bucklew Patricia K
Bought by
Moore Richard M
Home Financials for this Owner
Home Financials are based on the most recent Mortgage that was taken out on this home.
Original Mortgage
$76,000
Interest Rate
7.97%
Purchase Details
Closed on
Jun 3, 1988
Bought by
Bucklew Daniel S
Purchase Details
Closed on
Mar 1, 1986
Purchase Details
Closed on
Jan 1, 1986
Create a Home Valuation Report for This Property
The Home Valuation Report is an in-depth analysis detailing your home's value as well as a comparison with similar homes in the area
Home Values in the Area
Average Home Value in this Area
Purchase History
| Date | Buyer | Sale Price | Title Company |
|---|---|---|---|
| Ikon Properties Llc | -- | None Listed On Document | |
| Glandon Jeffrey A | $139,000 | None Available | |
| Lelko John H | $115,500 | -- | |
| Moore Richard M | $95,000 | Connor Title Co | |
| Bucklew Daniel S | $77,000 | -- | |
| -- | $42,300 | -- | |
| -- | $52,000 | -- |
Source: Public Records
Mortgage History
| Date | Status | Borrower | Loan Amount |
|---|---|---|---|
| Previous Owner | Lelko John H | $92,400 | |
| Previous Owner | Moore Richard M | $76,000 |
Source: Public Records
Tax History Compared to Growth
Tax History
| Year | Tax Paid | Tax Assessment Tax Assessment Total Assessment is a certain percentage of the fair market value that is determined by local assessors to be the total taxable value of land and additions on the property. | Land | Improvement |
|---|---|---|---|---|
| 2024 | $3,656 | $97,760 | $31,290 | $66,470 |
| 2023 | $3,593 | $97,755 | $31,290 | $66,465 |
| 2022 | $2,526 | $50,440 | $10,290 | $40,150 |
| 2021 | $2,576 | $50,440 | $10,290 | $40,150 |
| 2020 | $2,563 | $50,440 | $10,290 | $40,150 |
| 2019 | $2,422 | $42,040 | $8,580 | $33,460 |
| 2018 | $2,551 | $42,040 | $8,580 | $33,460 |
| 2017 | $2,403 | $42,040 | $8,580 | $33,460 |
| 2016 | $2,690 | $43,230 | $9,000 | $34,230 |
| 2015 | $2,690 | $43,230 | $9,000 | $34,230 |
| 2014 | $2,693 | $43,230 | $9,000 | $34,230 |
| 2013 | $1,405 | $45,465 | $9,450 | $36,015 |
Source: Public Records
Map
Nearby Homes
- 5824 Hunting Hollow Ct Unit 5824-5826
- 5728 Greendale Dr
- 242 Rockbrook Crossing Ave
- 440 Northforty Dr
- 5843 Tully Cross Dr
- 332 Rye St Unit Lot 53
- 320 Rye St Unit Lot 51
- 314 Rye St Unit Lot 50
- 308 Rye St Unit Lot 49
- 296 Rye St Unit Lot 48
- 290 Rye St Unit Lot 47
- 284 Rye St Unit Lot 46
- 278 Rye St Unit Lot 45
- 5722 Silver Spurs Ln
- 315 Rye St Unit Lot 121
- 301 Rye St Unit Lot 119
- 295 Rye St Unit Lot 118
- 603 Gleaming Dr Unit 259
- 773 Rothrock Dr
- 452 Pamlico St Unit 9
- 5807 Hunting Hollow Ct Unit 5809
- 5833 Hunting Hollow Ct
- 5831 Hunting Hollow Ct
- 5795 Hunting Hollow Ct
- 5795 Hunting Hollow Ct Unit 797
- 5800 Hunting Hollow Ct
- 5790 Hunting Hollow Ct
- UNK Sullivant Ave
- 5788 Hunting Hollow Ct
- 5783 Hunting Hollow Ct
- 5776 Hunting Hollow Ct Unit 5778
- 5809 Pepperwood Ct Unit 5811
- 381 Galloway Rd
- 5792 Pepperwood Ct
- 5784 Pepperwood Ct Unit 5784
- 5820 Sullivant Ave
- 5754 Hunting Hollow Ct Unit 5771
- 5802-5804 Pepperwood Ct
- 5802 Pepperwood Ct Unit 5804
- 5729 Greendale Dr