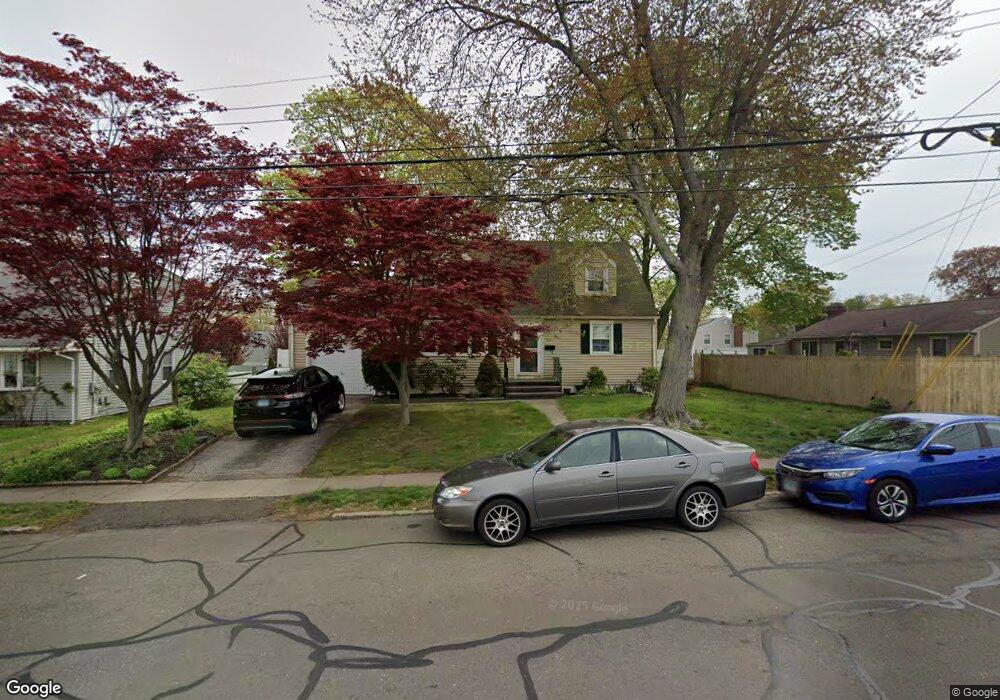
582 Freeman Ave Stratford, CT 06614
Estimated Value: $446,000 - $518,000
3
Beds
2
Baths
1,403
Sq Ft
$342/Sq Ft
Est. Value
About This Home
This home is located at 582 Freeman Ave, Stratford, CT 06614 and is currently estimated at $480,114, approximately $342 per square foot. 582 Freeman Ave is a home located in Fairfield County with nearby schools including Nichols Elementary School, David Wooster Middle School, and Stratford High School.
Ownership History
Date
Name
Owned For
Owner Type
Purchase Details
Closed on
Dec 19, 2003
Sold by
Bredice Raymond and Bredice Madeline
Bought by
Madsen Teri A
Current Estimated Value
Home Financials for this Owner
Home Financials are based on the most recent Mortgage that was taken out on this home.
Original Mortgage
$225,000
Outstanding Balance
$104,843
Interest Rate
5.96%
Estimated Equity
$375,271
Purchase Details
Closed on
Sep 20, 2000
Sold by
Derbyshire Andrew and Derbyshire Susan
Bought by
Bredice Raymond and Bredice Madeline A
Home Financials for this Owner
Home Financials are based on the most recent Mortgage that was taken out on this home.
Original Mortgage
$150,000
Interest Rate
8%
Purchase Details
Closed on
Apr 15, 1994
Sold by
Odice Eva
Bought by
Derbyshire Andrew and Correnti Susan
Home Financials for this Owner
Home Financials are based on the most recent Mortgage that was taken out on this home.
Original Mortgage
$128,000
Interest Rate
7.45%
Mortgage Type
Unknown
Create a Home Valuation Report for This Property
The Home Valuation Report is an in-depth analysis detailing your home's value as well as a comparison with similar homes in the area
Home Values in the Area
Average Home Value in this Area
Purchase History
| Date | Buyer | Sale Price | Title Company |
|---|---|---|---|
| Madsen Teri A | $250,000 | -- | |
| Bredice Raymond | $200,000 | -- | |
| Derbyshire Andrew | $135,000 | -- |
Source: Public Records
Mortgage History
| Date | Status | Borrower | Loan Amount |
|---|---|---|---|
| Open | Derbyshire Andrew | $225,000 | |
| Previous Owner | Derbyshire Andrew | $150,000 | |
| Previous Owner | Derbyshire Andrew | $128,000 |
Source: Public Records
Tax History Compared to Growth
Tax History
| Year | Tax Paid | Tax Assessment Tax Assessment Total Assessment is a certain percentage of the fair market value that is determined by local assessors to be the total taxable value of land and additions on the property. | Land | Improvement |
|---|---|---|---|---|
| 2025 | $7,173 | $178,430 | $96,390 | $82,040 |
| 2024 | $7,173 | $178,430 | $96,390 | $82,040 |
| 2023 | $7,173 | $178,430 | $96,390 | $82,040 |
| 2022 | $7,041 | $178,430 | $96,390 | $82,040 |
| 2021 | $7,043 | $178,430 | $96,390 | $82,040 |
| 2020 | $7,073 | $178,430 | $96,390 | $82,040 |
| 2019 | $6,511 | $163,310 | $83,580 | $79,730 |
| 2018 | $6,516 | $163,310 | $83,580 | $79,730 |
| 2017 | $6,528 | $163,310 | $83,580 | $79,730 |
| 2016 | $6,367 | $163,310 | $83,580 | $79,730 |
| 2015 | $6,039 | $163,310 | $83,580 | $79,730 |
| 2014 | $6,076 | $170,520 | $90,860 | $79,660 |
Source: Public Records
Map
Nearby Homes
- 248 Roger Dr
- 90 Mercer St
- 150 San Gabriel Ave
- 309 Freeman Ave
- 155 Burbank Ave
- 195 Lobdell Dr
- 290 Hollywood Ave
- 810 Nichols Ave
- 217 Huntington Rd
- 45 Albright Ave
- 125 Meadowbrook Rd
- 55 Woodcrest Ave
- 39 Parkway Dr
- 145 Dahl Ave
- 24 Brewster St
- 130 Marina Dr
- 100 Lambert Dr
- 55 Leighton Dr
- 10 Argonne Dr
- 25 Glenwood Ave
- 390 Mount Pleasant Ave
- 370 Mount Pleasant Ave
- 25 Burbank Dr
- 542 Freeman Ave
- 600 Freeman Ave
- 559 Freeman Ave
- 45 Burbank Dr
- 379 Mount Pleasant Ave
- 367 Mount Pleasant Ave
- 528 Freeman Ave
- 616 Freeman Ave
- 14 Burbank Dr
- 535 Freeman Ave
- 149 Lincoln St
- 55 Burbank Dr
- 175 Lincoln St
- 355 Mount Pleasant Ave
- 332 Mount Pleasant Ave
- 512 Freeman Ave
- 630 Freeman Ave