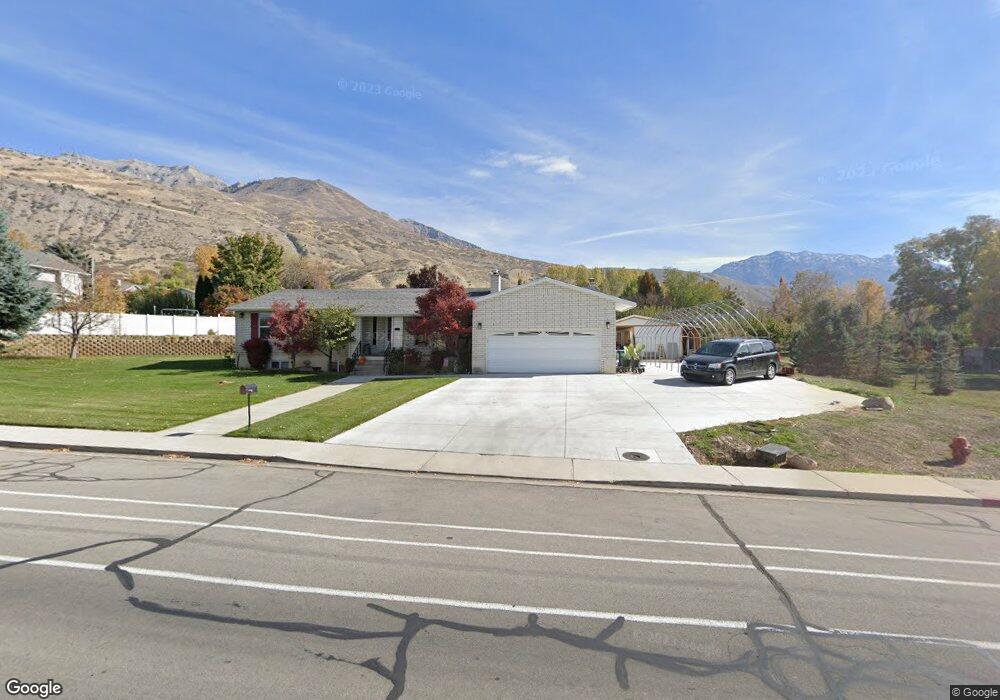
582 N 400 E Lindon, UT 84042
Estimated Value: $677,000 - $819,051
5
Beds
4
Baths
4,500
Sq Ft
$173/Sq Ft
Est. Value
About This Home
This home is located at 582 N 400 E, Lindon, UT 84042 and is currently estimated at $776,263, approximately $172 per square foot. 582 N 400 E is a home located in Utah County with nearby schools including Lindon Elementary School, Oak Canyon Junior High School, and Pleasant Grove High School.
Ownership History
Date
Name
Owned For
Owner Type
Purchase Details
Closed on
Mar 11, 2013
Sold by
Jensen Randy Lynn
Bought by
Jensen Randy Lynn and Jensen Lourdes M
Current Estimated Value
Purchase Details
Closed on
Apr 10, 2001
Sold by
Busby Thomas D and Busby Revocable Livi Darlene T
Bought by
Johnson Gary L and Johnson Bonnie S
Home Financials for this Owner
Home Financials are based on the most recent Mortgage that was taken out on this home.
Original Mortgage
$209,090
Outstanding Balance
$76,505
Interest Rate
6.92%
Mortgage Type
VA
Estimated Equity
$699,758
Create a Home Valuation Report for This Property
The Home Valuation Report is an in-depth analysis detailing your home's value as well as a comparison with similar homes in the area
Home Values in the Area
Average Home Value in this Area
Purchase History
| Date | Buyer | Sale Price | Title Company |
|---|---|---|---|
| Jensen Randy Lynn | -- | Keystone Title Ins Age | |
| Johnson Gary L | -- | Old Republic Title Company |
Source: Public Records
Mortgage History
| Date | Status | Borrower | Loan Amount |
|---|---|---|---|
| Open | Johnson Gary L | $209,090 |
Source: Public Records
Tax History
| Year | Tax Paid | Tax Assessment Tax Assessment Total Assessment is a certain percentage of the fair market value that is determined by local assessors to be the total taxable value of land and additions on the property. | Land | Improvement |
|---|---|---|---|---|
| 2025 | $2,782 | $372,680 | -- | -- |
| 2024 | $2,782 | $342,980 | $0 | $0 |
| 2023 | $2,651 | $351,065 | $0 | $0 |
| 2022 | $2,641 | $337,810 | $0 | $0 |
| 2021 | $2,244 | $432,800 | $202,500 | $230,300 |
| 2020 | $2,097 | $398,100 | $180,800 | $217,300 |
| 2019 | $1,770 | $350,700 | $155,000 | $195,700 |
| 2018 | $1,649 | $308,000 | $137,800 | $170,200 |
| 2017 | $1,451 | $145,310 | $0 | $0 |
| 2016 | $1,378 | $127,600 | $0 | $0 |
| 2015 | $1,457 | $127,600 | $0 | $0 |
| 2014 | $1,256 | $108,900 | $0 | $0 |
Source: Public Records
Map
Nearby Homes
Your Personal Tour Guide
Ask me questions while you tour the home.