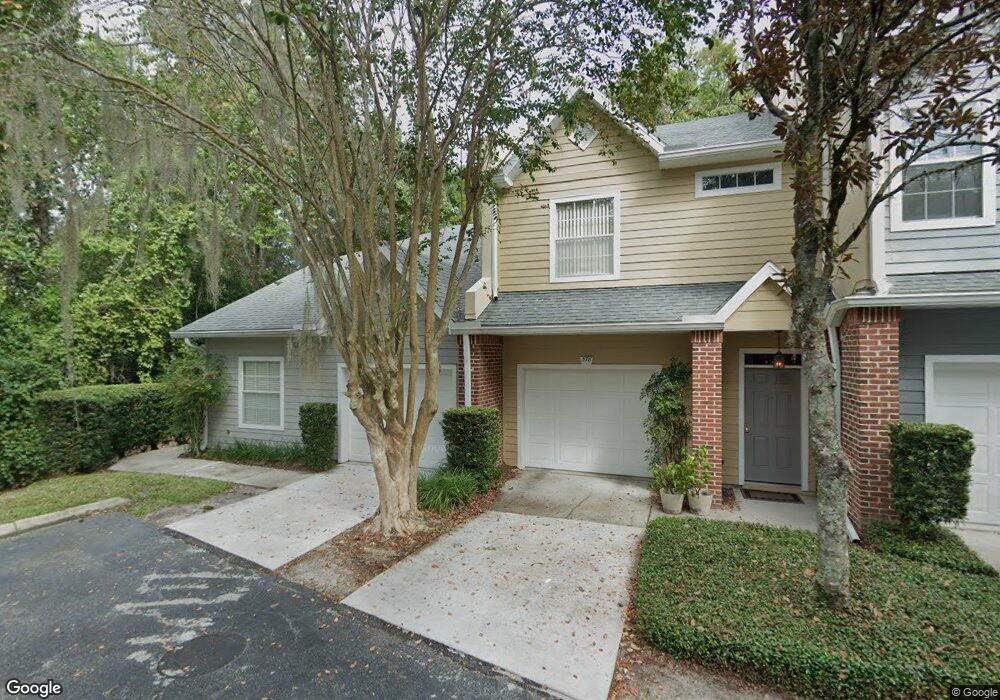
582 NW 50th Blvd Unit 16 Gainesville, FL 32607
Mill Pond NeighborhoodEstimated Value: $193,868 - $262,000
2
Beds
2
Baths
934
Sq Ft
$238/Sq Ft
Est. Value
About This Home
This home is located at 582 NW 50th Blvd Unit 16, Gainesville, FL 32607 and is currently estimated at $222,717, approximately $238 per square foot. 582 NW 50th Blvd Unit 16 is a home located in Alachua County with nearby schools including Myra Terwilliger Elementary School, F.W. Buchholz High School, and Kanapaha Middle School.
Ownership History
Date
Name
Owned For
Owner Type
Purchase Details
Closed on
Jun 17, 2002
Sold by
Park Joseph R and Park Sue Anne
Bought by
Beacher Will H and Beacher Ryan W
Current Estimated Value
Home Financials for this Owner
Home Financials are based on the most recent Mortgage that was taken out on this home.
Original Mortgage
$90,400
Outstanding Balance
$38,358
Interest Rate
6.86%
Estimated Equity
$184,359
Purchase Details
Closed on
Apr 30, 1999
Sold by
Clifford Curtis E
Bought by
Park Joseph R and Park Sue Anne
Home Financials for this Owner
Home Financials are based on the most recent Mortgage that was taken out on this home.
Original Mortgage
$73,600
Interest Rate
7.06%
Purchase Details
Closed on
Sep 17, 1998
Sold by
Millpond Development Inc
Bought by
Clifford Curtis E
Home Financials for this Owner
Home Financials are based on the most recent Mortgage that was taken out on this home.
Original Mortgage
$73,550
Interest Rate
6.95%
Create a Home Valuation Report for This Property
The Home Valuation Report is an in-depth analysis detailing your home's value as well as a comparison with similar homes in the area
Home Values in the Area
Average Home Value in this Area
Purchase History
| Date | Buyer | Sale Price | Title Company |
|---|---|---|---|
| Beacher Will H | $115,000 | -- | |
| Park Joseph R | $92,000 | -- | |
| Clifford Curtis E | $92,000 | -- |
Source: Public Records
Mortgage History
| Date | Status | Borrower | Loan Amount |
|---|---|---|---|
| Open | Beacher Will H | $90,400 | |
| Previous Owner | Park Joseph R | $73,600 | |
| Previous Owner | Clifford Curtis E | $73,550 |
Source: Public Records
Tax History Compared to Growth
Tax History
| Year | Tax Paid | Tax Assessment Tax Assessment Total Assessment is a certain percentage of the fair market value that is determined by local assessors to be the total taxable value of land and additions on the property. | Land | Improvement |
|---|---|---|---|---|
| 2024 | $3,341 | $159,061 | $40,000 | $119,061 |
| 2023 | $3,341 | $144,756 | $40,000 | $104,756 |
| 2022 | $3,059 | $137,963 | $45,000 | $92,963 |
| 2021 | $2,928 | $133,835 | $62,000 | $71,835 |
| 2020 | $2,618 | $114,829 | $42,000 | $72,829 |
| 2019 | $2,698 | $115,121 | $42,000 | $73,121 |
| 2018 | $2,375 | $107,600 | $34,000 | $73,600 |
| 2017 | $2,204 | $95,200 | $22,000 | $73,200 |
| 2016 | $2,172 | $91,500 | $0 | $0 |
| 2015 | $2,155 | $88,900 | $0 | $0 |
| 2014 | $881 | $75,600 | $0 | $0 |
| 2013 | -- | $72,600 | $22,000 | $50,600 |
Source: Public Records
Map
Nearby Homes
- 431 NW 50th Blvd
- 415 NW 50th Blvd
- 345 NW 48th Blvd Unit 345
- 364 NW 48th Blvd Unit K
- 331 NW 50th Blvd Unit K
- 5352 NW 8th Ave
- 243 NW 48th Blvd Unit 4
- 231 NW 48th Blvd
- 4950 NW 1st Place Unit 69
- 4942 NW 1st Place
- 5083 NW 1st Place
- 5067 NW 1st Place
- 1116 NW 50th Dr
- 5328 NW 9th Ln
- 0 NW 45th St
- 141 NW 46th St
- 833 NW 45th Terrace
- 4740 SW 1st Ave
- 4551 NW 1st Ave
- 1213 NW 55th St Unit 5
- 578 NW 50th Blvd Unit 15
- 574 NW 50th Blvd
- 570 NW 50th Blvd
- 570 NW 50 Blvd
- 566 NW 50 Blvd
- 562 NW 50th Blvd
- 562 NW 50 Blvd
- 615 NW 51 St
- 615 NW 51st St
- 607 NW 51st St
- 558 NW 50th Blvd Unit 17
- 550 NW 50th Blvd
- 550 NW 50th Blvd
- 539 NW 51st St
- 546 NW 50th Blvd Unit 20
- 546 NW 50th Blvd
- 546 NW 50th Blvd
- 542 NW 50th Blvd
- 542 NW 50th Blvd
- 514 NW 50 Blvd