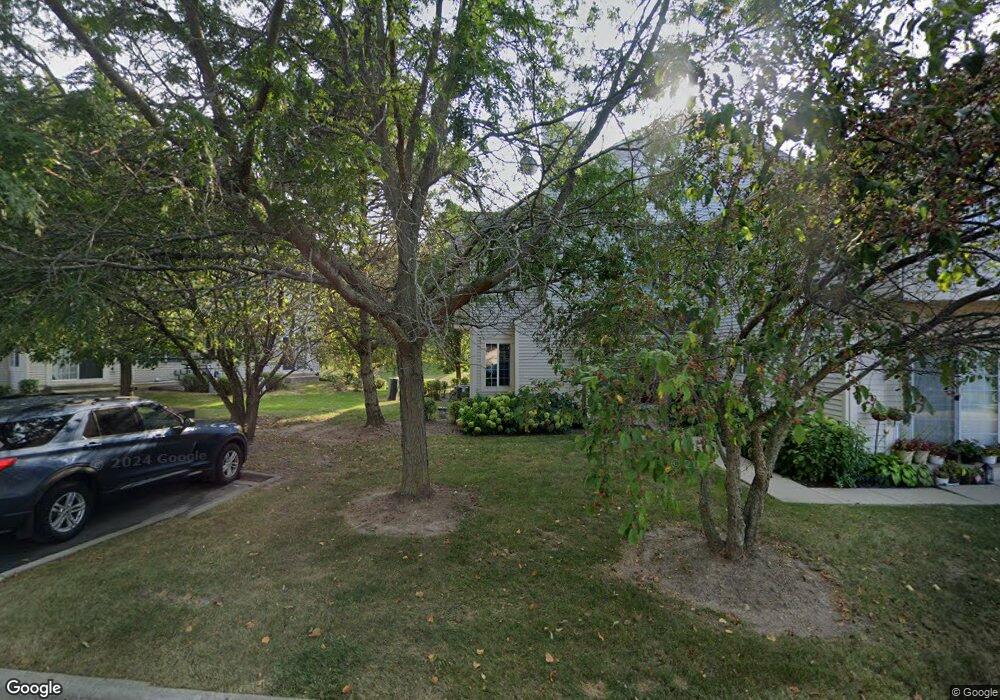
582 Windsor Dr Unit 38C Fox Lake, IL 60020
Estimated Value: $197,982 - $213,000
2
Beds
2
Baths
1,194
Sq Ft
$175/Sq Ft
Est. Value
About This Home
This home is located at 582 Windsor Dr Unit 38C, Fox Lake, IL 60020 and is currently estimated at $208,496, approximately $174 per square foot. 582 Windsor Dr Unit 38C is a home located in Lake County with nearby schools including Big Hollow Primary School, Big Hollow Elementary School, and Big Hollow Middle School.
Ownership History
Date
Name
Owned For
Owner Type
Purchase Details
Closed on
Feb 11, 2011
Sold by
Becchetti Kathleen A
Bought by
Becchetti Kathleen A and Kathleen A Beccheti Revocable
Current Estimated Value
Purchase Details
Closed on
Jul 24, 2009
Sold by
Carbonara Valerie L
Bought by
Becchetti Kathleen A
Purchase Details
Closed on
Jan 11, 2008
Sold by
Rodriguez Scott A and Rodriguez Miriam
Bought by
Carbonara Valerie L
Home Financials for this Owner
Home Financials are based on the most recent Mortgage that was taken out on this home.
Original Mortgage
$60,100
Interest Rate
5.75%
Mortgage Type
Purchase Money Mortgage
Purchase Details
Closed on
Dec 23, 2004
Sold by
Moctezuma Miriam and Rodriguez Miriam
Bought by
Rodriguez Scott A and Rodriguez Miriam
Home Financials for this Owner
Home Financials are based on the most recent Mortgage that was taken out on this home.
Original Mortgage
$136,000
Interest Rate
5.78%
Mortgage Type
New Conventional
Purchase Details
Closed on
Mar 1, 2002
Sold by
Windsor Development Corp
Bought by
Moctezuma Miriam
Home Financials for this Owner
Home Financials are based on the most recent Mortgage that was taken out on this home.
Original Mortgage
$138,100
Interest Rate
7.24%
Mortgage Type
FHA
Create a Home Valuation Report for This Property
The Home Valuation Report is an in-depth analysis detailing your home's value as well as a comparison with similar homes in the area
Home Values in the Area
Average Home Value in this Area
Purchase History
| Date | Buyer | Sale Price | Title Company |
|---|---|---|---|
| Becchetti Kathleen A | -- | None Available | |
| Becchetti Kathleen A | -- | None Available | |
| Carbonara Valerie L | $153,000 | Plm Title Company | |
| Rodriguez Scott A | -- | Chicago Title | |
| Moctezuma Miriam | $142,500 | Chicago Title |
Source: Public Records
Mortgage History
| Date | Status | Borrower | Loan Amount |
|---|---|---|---|
| Previous Owner | Carbonara Valerie L | $60,100 | |
| Previous Owner | Rodriguez Scott A | $136,000 | |
| Previous Owner | Moctezuma Miriam | $138,100 |
Source: Public Records
Tax History
| Year | Tax Paid | Tax Assessment Tax Assessment Total Assessment is a certain percentage of the fair market value that is determined by local assessors to be the total taxable value of land and additions on the property. | Land | Improvement |
|---|---|---|---|---|
| 2024 | $4,452 | $58,220 | $7,752 | $50,468 |
| 2023 | $4,652 | $54,847 | $7,303 | $47,544 |
| 2022 | $4,652 | $50,179 | $4,691 | $45,488 |
| 2021 | $4,178 | $43,161 | $4,422 | $38,739 |
| 2020 | $4,302 | $43,921 | $4,359 | $39,562 |
| 2019 | $4,154 | $42,118 | $4,180 | $37,938 |
| 2018 | $3,148 | $32,143 | $4,309 | $27,834 |
| 2017 | $3,079 | $29,710 | $3,983 | $25,727 |
| 2016 | $3,124 | $27,172 | $3,643 | $23,529 |
| 2015 | $2,977 | $25,357 | $3,400 | $21,957 |
| 2014 | $2,516 | $21,589 | $3,246 | $18,343 |
| 2012 | $2,675 | $22,497 | $3,383 | $19,114 |
Source: Public Records
Map
Nearby Homes
- 35403 N 2nd Ave
- 35828 N Marine Dr
- 515 Park Ave
- 61 Highview Ave
- 532 Circle Dr
- 11 Highview Ave
- 10 S Maple Ave
- 176 E Grand Ave
- 35769 N Cedar Island
- 235 E Grand Ave
- 21 Hillside Dr
- 127 E Grand Ave
- 35 Medinah Ave
- 310 Mastodon Dr
- 605 Rollins Rd
- 69 Washington St
- 200 Hollow Way
- 35359 N Donald Ct
- 10 Matts Rd
- 31 Lakeside Ln
- 578 Windsor Dr Unit 38A
- 578 Windsor Dr Unit 578
- 584 Windsor Dr Unit 38D
- 580 Windsor Dr Unit 38B
- 580 Windsor Dr Unit B
- 590 Windsor Dr Unit C39
- 592 Windsor Dr Unit 39D
- 588 Windsor Dr Unit B39
- 586 Windsor Dr Unit 1A
- 576 Windsor Dr Unit 37D
- 574 Windsor Dr Unit 37C
- 572 Windsor Dr
- 572 Windsor Dr Unit 572
- 585 Windsor Dr Unit 11D
- 593 Foxridge Dr Unit 35D
- 591 Foxridge Dr Unit 35C
- 581 Foxridge Dr Unit 36B
- 591 Fox Ridge Dr
- 581 Windsor Dr Unit 11B
- 581 Windsor Dr Unit 581
Your Personal Tour Guide
Ask me questions while you tour the home.