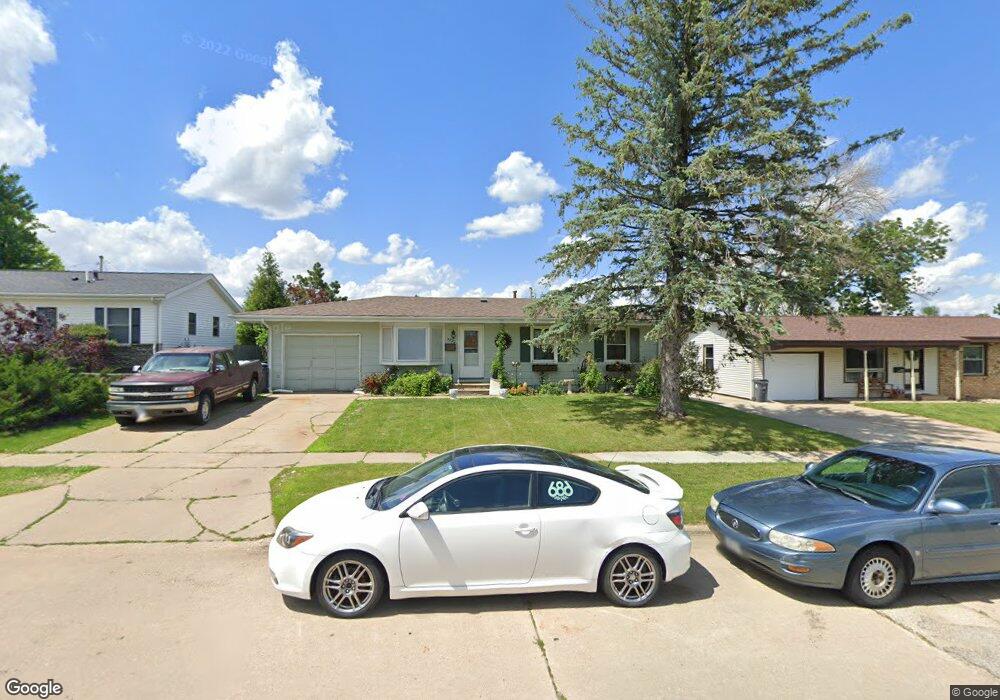
5820 Langdon Ave SW Cedar Rapids, IA 52404
Cherry Hill Park NeighborhoodEstimated Value: $199,000 - $219,000
3
Beds
2
Baths
1,001
Sq Ft
$209/Sq Ft
Est. Value
About This Home
This home is located at 5820 Langdon Ave SW, Cedar Rapids, IA 52404 and is currently estimated at $209,597, approximately $209 per square foot. 5820 Langdon Ave SW is a home located in Linn County with nearby schools including Junction City Elementary School, West Willow Elementary School, and Bourbon Central Elementary School.
Ownership History
Date
Name
Owned For
Owner Type
Purchase Details
Closed on
Jun 15, 2009
Sold by
Kennene Real Estate Exchange Lc
Bought by
Obrine Robert L and Obrine Valrine
Current Estimated Value
Purchase Details
Closed on
Jul 12, 2007
Sold by
Cichoski James W
Bought by
Kennene Real Estate Exchange Lc
Home Financials for this Owner
Home Financials are based on the most recent Mortgage that was taken out on this home.
Original Mortgage
$96,768
Interest Rate
6.73%
Mortgage Type
Unknown
Purchase Details
Closed on
Aug 20, 1999
Sold by
Pusateri Anthony R and Pusateri Leona F
Bought by
Cichoski James W and Cichoski Cory M
Home Financials for this Owner
Home Financials are based on the most recent Mortgage that was taken out on this home.
Original Mortgage
$71,500
Interest Rate
7.93%
Create a Home Valuation Report for This Property
The Home Valuation Report is an in-depth analysis detailing your home's value as well as a comparison with similar homes in the area
Home Values in the Area
Average Home Value in this Area
Purchase History
| Date | Buyer | Sale Price | Title Company |
|---|---|---|---|
| Obrine Robert L | $24,000 | None Available | |
| Kennene Real Estate Exchange Lc | $120,500 | None Available | |
| Cichoski James W | $79,500 | -- |
Source: Public Records
Mortgage History
| Date | Status | Borrower | Loan Amount |
|---|---|---|---|
| Previous Owner | Kennene Real Estate Exchange Lc | $96,768 | |
| Previous Owner | Cichoski James W | $71,500 |
Source: Public Records
Tax History Compared to Growth
Tax History
| Year | Tax Paid | Tax Assessment Tax Assessment Total Assessment is a certain percentage of the fair market value that is determined by local assessors to be the total taxable value of land and additions on the property. | Land | Improvement |
|---|---|---|---|---|
| 2025 | $2,578 | $180,100 | $37,600 | $142,500 |
| 2024 | $2,820 | $165,600 | $32,900 | $132,700 |
| 2023 | $2,820 | $156,100 | $32,900 | $123,200 |
| 2022 | $2,632 | $142,600 | $28,200 | $114,400 |
| 2021 | $2,632 | $136,000 | $28,200 | $107,800 |
| 2020 | $2,632 | $127,900 | $25,100 | $102,800 |
| 2019 | $2,458 | $122,600 | $25,100 | $97,500 |
| 2018 | $2,754 | $122,600 | $25,100 | $97,500 |
| 2017 | $2,453 | $117,200 | $25,100 | $92,100 |
| 2016 | $2,453 | $115,400 | $25,100 | $90,300 |
| 2015 | $2,523 | $118,558 | $25,088 | $93,470 |
| 2014 | $2,338 | $118,558 | $25,088 | $93,470 |
| 2013 | $2,284 | $118,558 | $25,088 | $93,470 |
Source: Public Records
Map
Nearby Homes
- 6008 Eastview Ave SW
- 323 Norwick Rd SW
- 6118 Greenbriar Ln SW Unit D
- 6305 Greenbriar Ln SW Unit B
- 164 Cherry Hill Rd NW
- 5918 Sharon Ln NW
- 150 Meadowlark Ln NW
- 106 Leroy St NW
- 5127 Holly Ave NW
- 200 Cherry Park Dr NW
- 1590 Stoney Pt Rd & 6600 16th Ave SW
- 6812 Underwood Ave SW
- 4975 Kesler Rd NW
- 281 Jacolyn Dr NW
- 236 Jacolyn Dr NW
- 6907 Rock Wood Dr SW
- 6608 Limestone Ct NW
- 272 Peace Ave NW
- 509 Grey Slate Dr SW
- 229 Jacolyn Dr NW
- 5830 Langdon Ave SW
- 5810 Langdon Ave SW
- 5833 Eastview Ave SW
- 5911 Eastview Ave SW
- 5906 Langdon Ave SW
- 5772 Langdon Ave SW
- 5825 Eastview Ave SW Unit I
- 5921 Eastview Ave SW
- 5815 Langdon Ct SW
- 5916 Langdon Ave SW
- 5769 Langdon Ave SW
- 5764 Langdon Ave SW
- 5931 Eastview Ave SW
- 5926 Langdon Ave SW
- 5807 Eastview Ave SW
- 5915 Langdon Ct SW
- 6005 Eastview Ave SW
- 5758 Langdon Ave SW
- 5910 Eastview Ave SW
- 5826 Eastview Ave SW