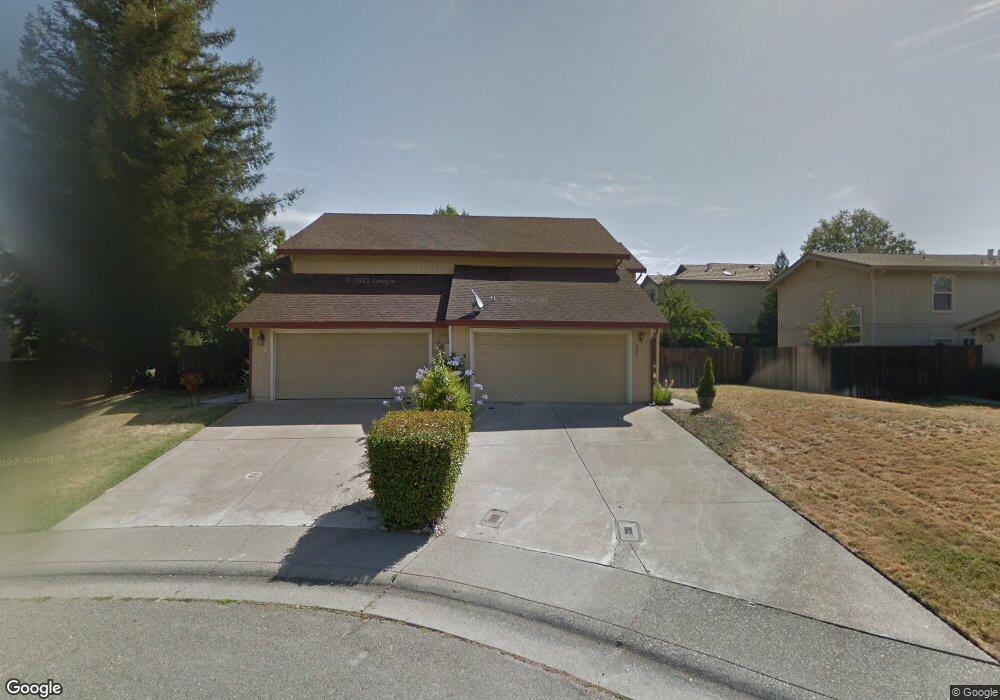
5820 Sequoia Ct Unit 3 Rocklin, CA 95677
Woodside NeighborhoodEstimated Value: $426,000 - $470,091
3
Beds
2
Baths
1,333
Sq Ft
$337/Sq Ft
Est. Value
About This Home
This home is located at 5820 Sequoia Ct Unit 3, Rocklin, CA 95677 and is currently estimated at $448,773, approximately $336 per square foot. 5820 Sequoia Ct Unit 3 is a home located in Placer County with nearby schools including Rocklin Elementary School, Spring View Middle School, and Rocklin High.
Ownership History
Date
Name
Owned For
Owner Type
Purchase Details
Closed on
May 25, 2015
Sold by
Mccauslin Bettina T
Bought by
Mccauslin Bettina T
Current Estimated Value
Purchase Details
Closed on
Feb 25, 2003
Sold by
Garnett James L and Garnett Pamela F
Bought by
Mccauslin Bettina T
Home Financials for this Owner
Home Financials are based on the most recent Mortgage that was taken out on this home.
Original Mortgage
$196,227
Outstanding Balance
$84,666
Interest Rate
5.93%
Mortgage Type
FHA
Estimated Equity
$364,107
Purchase Details
Closed on
Jan 6, 1994
Sold by
Stevens H Don
Bought by
Garnett James L and Garnett Pamela F
Home Financials for this Owner
Home Financials are based on the most recent Mortgage that was taken out on this home.
Original Mortgage
$103,927
Interest Rate
7.29%
Mortgage Type
FHA
Create a Home Valuation Report for This Property
The Home Valuation Report is an in-depth analysis detailing your home's value as well as a comparison with similar homes in the area
Home Values in the Area
Average Home Value in this Area
Purchase History
| Date | Buyer | Sale Price | Title Company |
|---|---|---|---|
| Mccauslin Bettina T | -- | None Available | |
| Mccauslin Bettina T | $199,000 | Placer Title Company | |
| Garnett James L | $104,000 | North American Title Co Inc |
Source: Public Records
Mortgage History
| Date | Status | Borrower | Loan Amount |
|---|---|---|---|
| Open | Mccauslin Bettina T | $196,227 | |
| Previous Owner | Garnett James L | $103,927 |
Source: Public Records
Tax History
| Year | Tax Paid | Tax Assessment Tax Assessment Total Assessment is a certain percentage of the fair market value that is determined by local assessors to be the total taxable value of land and additions on the property. | Land | Improvement |
|---|---|---|---|---|
| 2025 | $3,108 | $288,193 | $115,854 | $172,339 |
| 2023 | $3,108 | $277,004 | $111,356 | $165,648 |
| 2022 | $3,006 | $271,573 | $109,173 | $162,400 |
| 2021 | $2,972 | $266,249 | $107,033 | $159,216 |
| 2020 | $2,967 | $263,520 | $105,936 | $157,584 |
| 2019 | $2,925 | $258,354 | $103,859 | $154,495 |
| 2018 | $2,849 | $253,289 | $101,823 | $151,466 |
| 2017 | $2,851 | $248,324 | $99,827 | $148,497 |
| 2016 | $2,769 | $243,456 | $97,870 | $145,586 |
| 2015 | $2,734 | $239,800 | $96,400 | $143,400 |
| 2014 | -- | $228,000 | $91,700 | $136,300 |
Source: Public Records
Map
Nearby Homes
- 5967 Woodside Dr
- 5810 Elmwood Ct
- 3819 Anders Way
- 3916 Wickman Loop
- 5505 S Grove St Unit 101
- 5505 S Grove St Unit 119
- 5505 S Grove St Unit 316
- 5505 S Grove St Unit 29
- Alderwood Plan at Vista Oaks
- Cloverwood Plan at Vista Oaks
- Burwood Plan at Vista Oaks
- 4107 Hard Rock Ct
- 2173 Viola Way
- 4184 Oakview Dr
- 2081 Sebastian Way
- 6581 Hearthstone Cir
- 4023 Cornwall Ct
- 5208 Levison Way
- 4298 Oakwood St
- 4275 Fernwood St
- 5824 Sequoia Ct
- 5814 Sequoia Ct
- 5909 Lindsay Ct
- 5810 Sequoia Ct
- 5830 Sequoia Ct
- 5907 Lindsay Ct
- 5804 Sequoia Ct
- 5834 Sequoia Ct
- 5908 Lindsay Ct
- 5905 Lindsay Ct
- 5840 Sequoia Ct
- 5996 Woodside Dr
- 5906 Lindsay Ct
- 5994 Woodside Dr
- 5800 Sequoia Ct Unit 3
- 5844 Sequoia Ct
- 5903 Lindsay Ct
- 5986 Woodside Dr
- 5860 Sequoia Ct
- 5904 Lindsay Ct