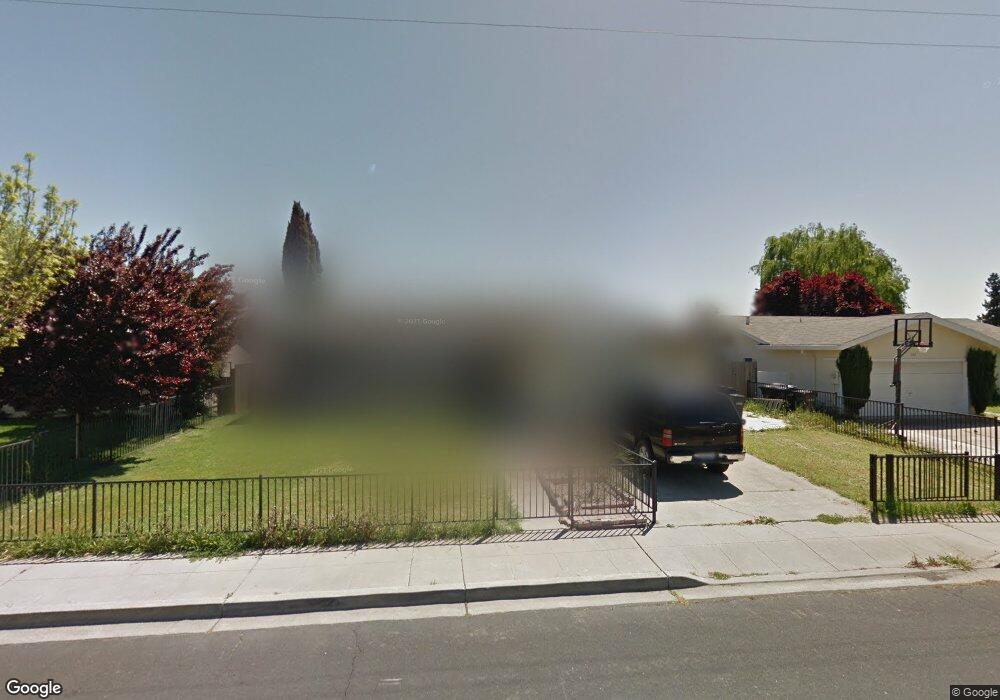
5823 Running Hills Ave Livermore, CA 94551
Springtown NeighborhoodEstimated Value: $803,000 - $944,000
3
Beds
2
Baths
1,006
Sq Ft
$868/Sq Ft
Est. Value
About This Home
This home is located at 5823 Running Hills Ave, Livermore, CA 94551 and is currently estimated at $873,437, approximately $868 per square foot. 5823 Running Hills Ave is a home located in Alameda County with nearby schools including Altamont Creek Elementary School, Andrew N. Christensen Middle School, and Livermore High School.
Ownership History
Date
Name
Owned For
Owner Type
Purchase Details
Closed on
Aug 18, 2017
Sold by
Knoth Crystal
Bought by
Bunch Grady Ray and Knoth Crystal Ann
Current Estimated Value
Purchase Details
Closed on
Jan 31, 2013
Sold by
Ziebarth Anthony D and Ziebarth Ann D
Bought by
Knoth Crystal
Home Financials for this Owner
Home Financials are based on the most recent Mortgage that was taken out on this home.
Original Mortgage
$281,250
Outstanding Balance
$193,952
Interest Rate
3.12%
Mortgage Type
Adjustable Rate Mortgage/ARM
Estimated Equity
$679,485
Purchase Details
Closed on
Jan 12, 2010
Sold by
Wallace Russell I
Bought by
Ziebarth Anthony D and Ziebarth Ann D
Home Financials for this Owner
Home Financials are based on the most recent Mortgage that was taken out on this home.
Original Mortgage
$279,837
Interest Rate
4.78%
Mortgage Type
FHA
Purchase Details
Closed on
Feb 4, 2009
Sold by
Wallace Russell I and The Daniel & Betty Wallace 199
Bought by
Wallace Russell I
Create a Home Valuation Report for This Property
The Home Valuation Report is an in-depth analysis detailing your home's value as well as a comparison with similar homes in the area
Home Values in the Area
Average Home Value in this Area
Purchase History
| Date | Buyer | Sale Price | Title Company |
|---|---|---|---|
| Bunch Grady Ray | -- | None Available | |
| Knoth Crystal | $375,000 | Cornerstone Title Company | |
| Ziebarth Anthony D | $285,000 | Cornerstone Title Company | |
| Wallace Russell I | -- | None Available |
Source: Public Records
Mortgage History
| Date | Status | Borrower | Loan Amount |
|---|---|---|---|
| Open | Knoth Crystal | $281,250 | |
| Previous Owner | Ziebarth Anthony D | $279,837 |
Source: Public Records
Tax History Compared to Growth
Tax History
| Year | Tax Paid | Tax Assessment Tax Assessment Total Assessment is a certain percentage of the fair market value that is determined by local assessors to be the total taxable value of land and additions on the property. | Land | Improvement |
|---|---|---|---|---|
| 2025 | $6,285 | $461,767 | $138,530 | $323,237 |
| 2024 | $6,285 | $452,714 | $135,814 | $316,900 |
| 2023 | $6,184 | $443,838 | $133,151 | $310,687 |
| 2022 | $6,087 | $435,138 | $130,541 | $304,597 |
| 2021 | $5,216 | $426,607 | $127,982 | $298,625 |
| 2020 | $5,778 | $422,234 | $126,670 | $295,564 |
| 2019 | $5,714 | $413,958 | $124,187 | $289,771 |
| 2018 | $5,583 | $405,843 | $121,753 | $284,090 |
| 2017 | $5,433 | $397,885 | $119,365 | $278,520 |
| 2016 | $5,223 | $390,085 | $117,025 | $273,060 |
| 2015 | $4,920 | $384,228 | $115,268 | $268,960 |
| 2014 | $4,894 | $376,701 | $113,010 | $263,691 |
Source: Public Records
Map
Nearby Homes
- 6373 Altamar Cir
- 5904 Skylinks Way
- 5740 Woodrose Way
- 5889 Woodrose Way
- 0 Dalton Ave Unit 225094100
- 1121 Riviera Ct
- 6432 Laurel Creek Place
- 5749 Cherry Way
- 5801 Flora Common
- 883 Barney Com
- 1370 Daisy Ln
- 829 Berryessa Ct
- 1333 Daisy Ln
- 1817 Bluebell Dr
- 725 Central Ave
- 5473 Rainflower Dr
- 5179 Crocus Way
- 5315 Rainflower Dr
- 1241 Hibiscus Way
- 2135 Bluebell Dr
- 5807 Running Hills Ave
- 5835 Running Hills Ave
- 5826 Singing Hills Ave
- 5802 Singing Hills Ave
- 5834 Singing Hills Ave
- 5849 Running Hills Ave
- 5824 Running Hills Ave
- 5858 Singing Hills Ave
- 5836 Running Hills Ave
- 5808 Running Hills Ave
- 5860 Running Hills Ave
- 5861 Running Hills Ave
- 5870 Singing Hills Ave
- 5825 Singing Hills Ave
- 5755 Running Hills Ave
- 5821 Idlewild Ave
- 5833 Singing Hills Ave
- 5749 Singing Hills Ave
- 5809 Idlewild Ave