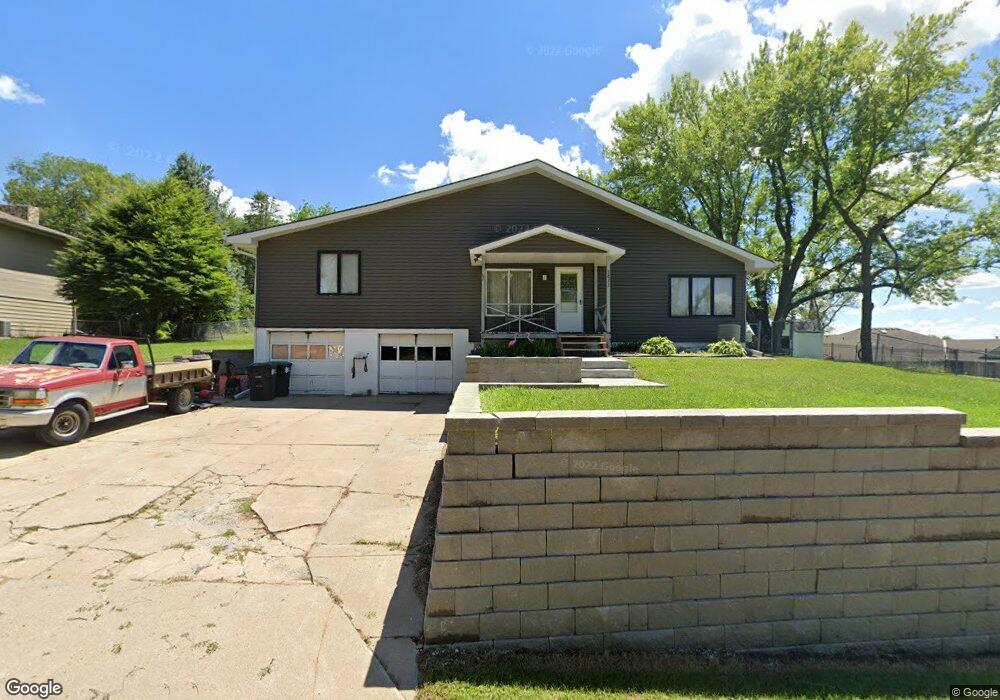
5823 T St Omaha, NE 68117
South Central Omaha NeighborhoodEstimated Value: $262,707 - $346,000
3
Beds
5
Baths
2,260
Sq Ft
$134/Sq Ft
Est. Value
About This Home
This home is located at 5823 T St, Omaha, NE 68117 and is currently estimated at $303,927, approximately $134 per square foot. 5823 T St is a home located in Douglas County with nearby schools including Gateway Elementary School, Bryan High School, and St. Peter Claver Christo Rey High School.
Ownership History
Date
Name
Owned For
Owner Type
Purchase Details
Closed on
May 1, 2017
Sold by
Franke Luella M
Bought by
Franke Luella M and Franke Delwyn L
Current Estimated Value
Purchase Details
Closed on
Apr 30, 2008
Sold by
Biggs William L
Bought by
Franke Luella
Purchase Details
Closed on
Jul 13, 2006
Sold by
Franke Mary E
Bought by
Biggs William L
Purchase Details
Closed on
Nov 2, 2001
Sold by
Dooley Rod G and Dooley Judith E
Bought by
Larsen Mary E
Home Financials for this Owner
Home Financials are based on the most recent Mortgage that was taken out on this home.
Original Mortgage
$112,000
Interest Rate
6.54%
Create a Home Valuation Report for This Property
The Home Valuation Report is an in-depth analysis detailing your home's value as well as a comparison with similar homes in the area
Home Values in the Area
Average Home Value in this Area
Purchase History
| Date | Buyer | Sale Price | Title Company |
|---|---|---|---|
| Franke Luella M | -- | None Available | |
| Franke Luella | $144,500 | -- | |
| Biggs William L | $143,600 | -- | |
| Larsen Mary E | $134,285 | -- |
Source: Public Records
Mortgage History
| Date | Status | Borrower | Loan Amount |
|---|---|---|---|
| Previous Owner | Larsen Mary E | $112,000 |
Source: Public Records
Tax History Compared to Growth
Tax History
| Year | Tax Paid | Tax Assessment Tax Assessment Total Assessment is a certain percentage of the fair market value that is determined by local assessors to be the total taxable value of land and additions on the property. | Land | Improvement |
|---|---|---|---|---|
| 2025 | $3,512 | $236,400 | $33,300 | $203,100 |
| 2024 | $4,298 | $215,100 | $33,300 | $181,800 |
| 2023 | $4,298 | $203,700 | $33,300 | $170,400 |
| 2022 | $4,212 | $197,300 | $26,900 | $170,400 |
| 2021 | $3,721 | $175,800 | $26,900 | $148,900 |
| 2020 | $2,997 | $140,000 | $13,900 | $126,100 |
| 2019 | $2,897 | $134,900 | $13,900 | $121,000 |
| 2018 | $2,901 | $134,900 | $13,900 | $121,000 |
| 2017 | $3,189 | $147,600 | $19,000 | $128,600 |
| 2016 | $2,940 | $137,000 | $16,100 | $120,900 |
Source: Public Records
Map
Nearby Homes
- 5002 S 59th St
- 5716 Orchard Ave
- 5114 Q St
- 5902 S 50th St
- 4868 S 53rd St
- 5108 Jefferson St
- 4814 S 50th Ave
- 4992 Drexel St
- 5841 S 48th Ave
- 6205 J St
- 4819 S 50th St
- 4464 S 61st St
- 6058 Patterson St
- 6118 Patterson St
- 4431 S 63rd St
- 6157 & 6159 Hillsdale Ave
- 7210 Wood River Dr
- 6070 Buckingham Ave
- 16 & 18 Country Club Rd
- 6222 S 43rd St