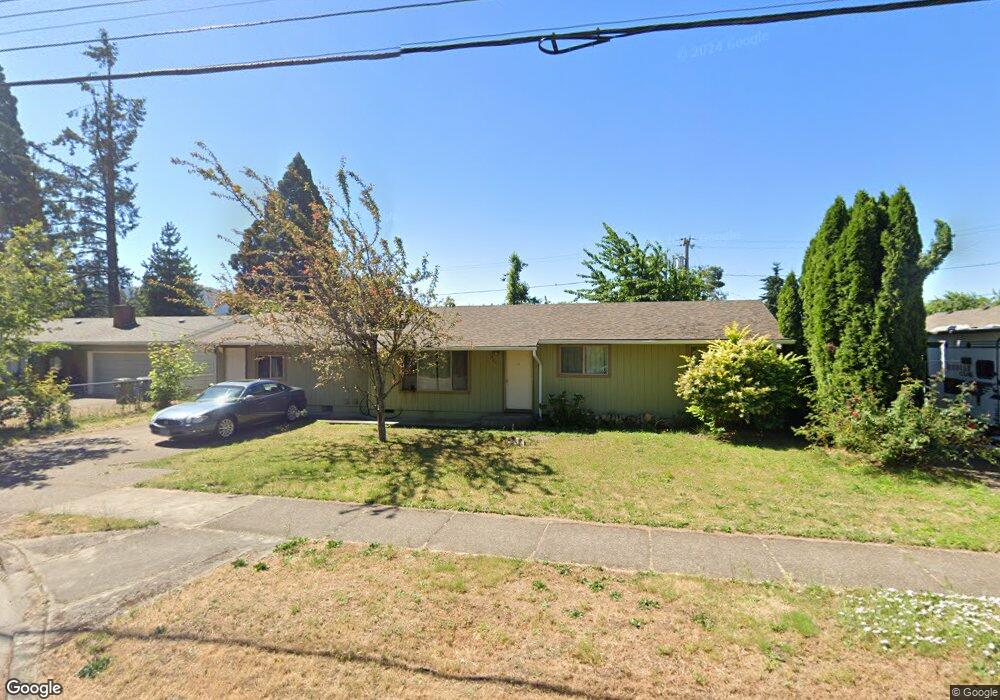
5823 Thurston Rd Springfield, OR 97478
Thurston NeighborhoodEstimated Value: $380,000 - $409,000
3
Beds
2
Baths
1,492
Sq Ft
$267/Sq Ft
Est. Value
About This Home
This home is located at 5823 Thurston Rd, Springfield, OR 97478 and is currently estimated at $397,667, approximately $266 per square foot. 5823 Thurston Rd is a home located in Lane County with nearby schools including Ridgeview Elementary School, Thurston Middle School, and Thurston High School.
Ownership History
Date
Name
Owned For
Owner Type
Purchase Details
Closed on
Aug 17, 2006
Sold by
Whitney Sam R
Bought by
Shubin Rebecca
Current Estimated Value
Home Financials for this Owner
Home Financials are based on the most recent Mortgage that was taken out on this home.
Original Mortgage
$101,650
Outstanding Balance
$61,029
Interest Rate
6.76%
Mortgage Type
Unknown
Estimated Equity
$336,638
Purchase Details
Closed on
Aug 6, 2002
Sold by
Chandler Frank E and Chandler Donna M
Bought by
Whitney Sam R
Home Financials for this Owner
Home Financials are based on the most recent Mortgage that was taken out on this home.
Original Mortgage
$70,800
Interest Rate
9.99%
Purchase Details
Closed on
Jun 3, 1998
Sold by
Gill Carmella
Bought by
Michael Carmella Denise
Create a Home Valuation Report for This Property
The Home Valuation Report is an in-depth analysis detailing your home's value as well as a comparison with similar homes in the area
Home Values in the Area
Average Home Value in this Area
Purchase History
| Date | Buyer | Sale Price | Title Company |
|---|---|---|---|
| Shubin Rebecca | -- | Pacific Northwest Title Of L | |
| Whitney Sam R | $95,000 | Fidelity National Title Co | |
| Michael Carmella Denise | -- | Key Title Company |
Source: Public Records
Mortgage History
| Date | Status | Borrower | Loan Amount |
|---|---|---|---|
| Open | Shubin Rebecca | $101,650 | |
| Previous Owner | Whitney Sam R | $70,800 |
Source: Public Records
Tax History Compared to Growth
Tax History
| Year | Tax Paid | Tax Assessment Tax Assessment Total Assessment is a certain percentage of the fair market value that is determined by local assessors to be the total taxable value of land and additions on the property. | Land | Improvement |
|---|---|---|---|---|
| 2024 | $3,061 | $164,750 | -- | -- |
| 2023 | $3,061 | $159,952 | $0 | $0 |
| 2022 | $2,835 | $155,294 | $0 | $0 |
| 2021 | $2,784 | $150,771 | $0 | $0 |
| 2020 | $2,703 | $146,380 | $0 | $0 |
| 2019 | $2,622 | $142,117 | $0 | $0 |
| 2018 | $2,472 | $133,959 | $0 | $0 |
| 2017 | $2,377 | $133,959 | $0 | $0 |
| 2016 | $2,327 | $130,057 | $0 | $0 |
| 2015 | $2,260 | $126,269 | $0 | $0 |
| 2014 | $2,226 | $122,591 | $0 | $0 |
Source: Public Records
Map
Nearby Homes
- 676 58th St
- 1125 58th St Unit 64
- 1125 58th St Unit 96
- 5621 C St
- 802 54th Place
- 1025 54th St
- 5995 Main St
- 193 62nd Place
- 544 65th St
- 5360 B St
- 5495 A St
- 5495 A Units 69 70 71 72 St
- 5244 D St
- 6445 B St
- 495 52nd St
- 205 S 54th St
- 205 S 54th St Unit 23
- 205 S 54th St Unit 117
- 205 S 54th St Unit 108
- 205 S 54th St Unit 64