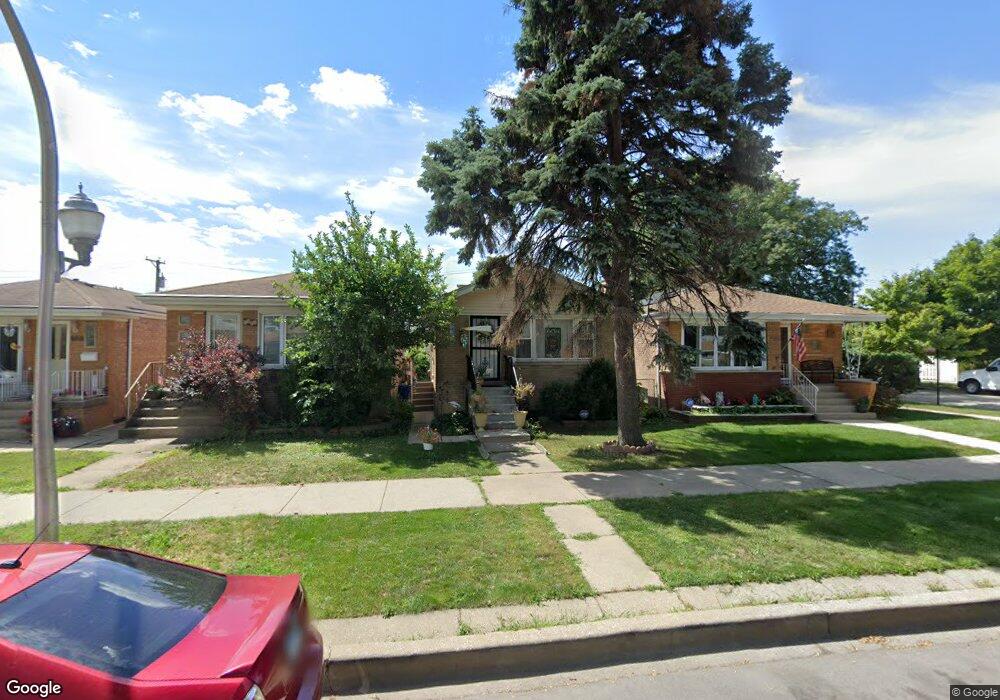
5823 W 59th St Chicago, IL 60638
Garfield Ridge NeighborhoodEstimated Value: $286,000 - $334,000
3
Beds
1
Bath
836
Sq Ft
$367/Sq Ft
Est. Value
About This Home
This home is located at 5823 W 59th St, Chicago, IL 60638 and is currently estimated at $306,879, approximately $367 per square foot. 5823 W 59th St is a home located in Cook County with nearby schools including Kinzie Elementary School, Kennedy High School, and St. Symphorosa Catholic School.
Ownership History
Date
Name
Owned For
Owner Type
Purchase Details
Closed on
Mar 14, 2005
Sold by
Przydzial Edward and Soja Bronislawa
Bought by
Soja Bronislaw
Current Estimated Value
Purchase Details
Closed on
Apr 4, 2002
Sold by
Savage Charles J
Bought by
Przydzial Edward and Soja Bronislawa
Home Financials for this Owner
Home Financials are based on the most recent Mortgage that was taken out on this home.
Original Mortgage
$109,600
Interest Rate
6.12%
Purchase Details
Closed on
Mar 7, 2002
Sold by
Suchy Virginia A
Bought by
Przydzial Edward and Soja Bronislawa
Home Financials for this Owner
Home Financials are based on the most recent Mortgage that was taken out on this home.
Original Mortgage
$109,600
Interest Rate
6.12%
Purchase Details
Closed on
Mar 4, 2002
Sold by
Soja Bronislawa and Przydzial Edward
Bought by
Prairie Bank & Trust Company and Trust #02-206
Home Financials for this Owner
Home Financials are based on the most recent Mortgage that was taken out on this home.
Original Mortgage
$109,600
Interest Rate
6.12%
Create a Home Valuation Report for This Property
The Home Valuation Report is an in-depth analysis detailing your home's value as well as a comparison with similar homes in the area
Home Values in the Area
Average Home Value in this Area
Purchase History
| Date | Buyer | Sale Price | Title Company |
|---|---|---|---|
| Soja Bronislaw | -- | -- | |
| Przydzial Edward | -- | First American Title | |
| Przydzial Edward | -- | First American Title | |
| Przydzial Edward | -- | First American Title | |
| Prairie Bank & Trust Company | -- | -- |
Source: Public Records
Mortgage History
| Date | Status | Borrower | Loan Amount |
|---|---|---|---|
| Previous Owner | Przydzial Edward | $109,600 |
Source: Public Records
Tax History
| Year | Tax Paid | Tax Assessment Tax Assessment Total Assessment is a certain percentage of the fair market value that is determined by local assessors to be the total taxable value of land and additions on the property. | Land | Improvement |
|---|---|---|---|---|
| 2025 | $3,611 | $22,324 | $4,375 | $17,949 |
| 2024 | $3,611 | $22,324 | $4,375 | $17,949 |
| 2023 | $4,052 | $17,023 | $3,906 | $13,117 |
| 2022 | $4,052 | $19,590 | $3,906 | $15,684 |
| 2021 | $4,223 | $20,999 | $3,906 | $17,093 |
| 2020 | $3,451 | $15,392 | $3,125 | $12,267 |
| 2019 | $3,458 | $17,103 | $3,125 | $13,978 |
| 2018 | $3,711 | $18,666 | $3,125 | $15,541 |
| 2017 | $2,896 | $13,365 | $2,812 | $10,553 |
| 2016 | $2,694 | $13,365 | $2,812 | $10,553 |
| 2015 | $2,672 | $14,475 | $2,812 | $11,663 |
| 2014 | $2,241 | $11,986 | $2,656 | $9,330 |
| 2013 | $2,437 | $13,292 | $2,656 | $10,636 |
Source: Public Records
Map
Nearby Homes
- 5910 W 59th St
- 5814 S Massasoit Ave
- 5929 S Major Ave
- 6334 S Austin Ave
- 6058 S Massasoit Ave
- 5810 S Austin Ave
- 5831 S Meade Ave
- 5658 S Austin Ave
- 6152 S Austin Ave
- 6207 S Austin Ave
- 6158 W 60th St Unit 10
- 5723 S Melvina Ave
- 5734 S Melvina Ave
- 5729 W 63rd St Unit 3N
- 5718 W 63rd Place
- 7754 S Mcvicker Ave
- 6025 W 55th St
- 5850 W 55th St Unit 3F
- 6119 W 55th St
- 5817 W 64th St
- 5821 W 59th St
- 5825 W 59th St
- 5817 W 59th St
- 5815 W 59th St
- 5915 S Monitor Ave
- 5811 W 59th St
- 5919 S Monitor Ave
- 5809 W 59th St
- 5835 W 59th St
- 5921 S Monitor Ave
- 5807 W 59th St
- 5839 W 59th St
- 5803 W 59th St
- 5923 S Monitor Ave
- 5841 W 59th St
- 5914 S Menard Ave
- 5820 W 59th St
- 5818 W 59th St
- 5824 W 59th St
- 5914 S Monitor Ave
Your Personal Tour Guide
Ask me questions while you tour the home.