5824 W Little Richland Rd Waverly, TN 37185
Estimated Value: $395,739 - $867,000
--
Bed
3
Baths
1,852
Sq Ft
$300/Sq Ft
Est. Value
About This Home
This home is located at 5824 W Little Richland Rd, Waverly, TN 37185 and is currently estimated at $555,935, approximately $300 per square foot. 5824 W Little Richland Rd is a home located in Humphreys County.
Ownership History
Date
Name
Owned For
Owner Type
Purchase Details
Closed on
Mar 26, 2018
Sold by
Weber Thorpe D
Bought by
Denise Stookey Shawn L and Stookey Cheryl Denise C
Current Estimated Value
Purchase Details
Closed on
Feb 18, 2000
Sold by
Terry Dixon W
Bought by
Jerry Dunlap
Purchase Details
Closed on
Oct 24, 1988
Bought by
Dixon Dixon W and Dixon Jeanie L
Purchase Details
Closed on
Sep 30, 1976
Bought by
Rye Hilton Thomas and Rye Linda B
Purchase Details
Closed on
Sep 12, 1972
Create a Home Valuation Report for This Property
The Home Valuation Report is an in-depth analysis detailing your home's value as well as a comparison with similar homes in the area
Home Values in the Area
Average Home Value in this Area
Purchase History
| Date | Buyer | Sale Price | Title Company |
|---|---|---|---|
| Denise Stookey Shawn L | $250,000 | None Available | |
| Jerry Dunlap | $163,000 | -- | |
| Dixon Dixon W | $80,000 | -- | |
| Rye Hilton Thomas | -- | -- | |
| -- | -- | -- |
Source: Public Records
Tax History Compared to Growth
Tax History
| Year | Tax Paid | Tax Assessment Tax Assessment Total Assessment is a certain percentage of the fair market value that is determined by local assessors to be the total taxable value of land and additions on the property. | Land | Improvement |
|---|---|---|---|---|
| 2025 | $1,818 | $99,125 | $0 | $0 |
| 2024 | $1,818 | $98,800 | $16,250 | $82,550 |
| 2023 | $1,818 | $98,800 | $16,250 | $82,550 |
| 2022 | $1,317 | $60,400 | $12,625 | $47,775 |
| 2021 | $1,317 | $60,400 | $12,625 | $47,775 |
| 2020 | $1,317 | $60,400 | $12,625 | $47,775 |
| 2019 | $1,032 | $50,750 | $12,500 | $38,250 |
| 2018 | $1,082 | $50,750 | $12,500 | $38,250 |
| 2017 | $1,082 | $53,225 | $16,075 | $37,150 |
| 2016 | $1,022 | $46,475 | $14,625 | $31,850 |
| 2015 | $1,022 | $46,475 | $14,625 | $31,850 |
| 2014 | $1,022 | $46,474 | $0 | $0 |
Source: Public Records
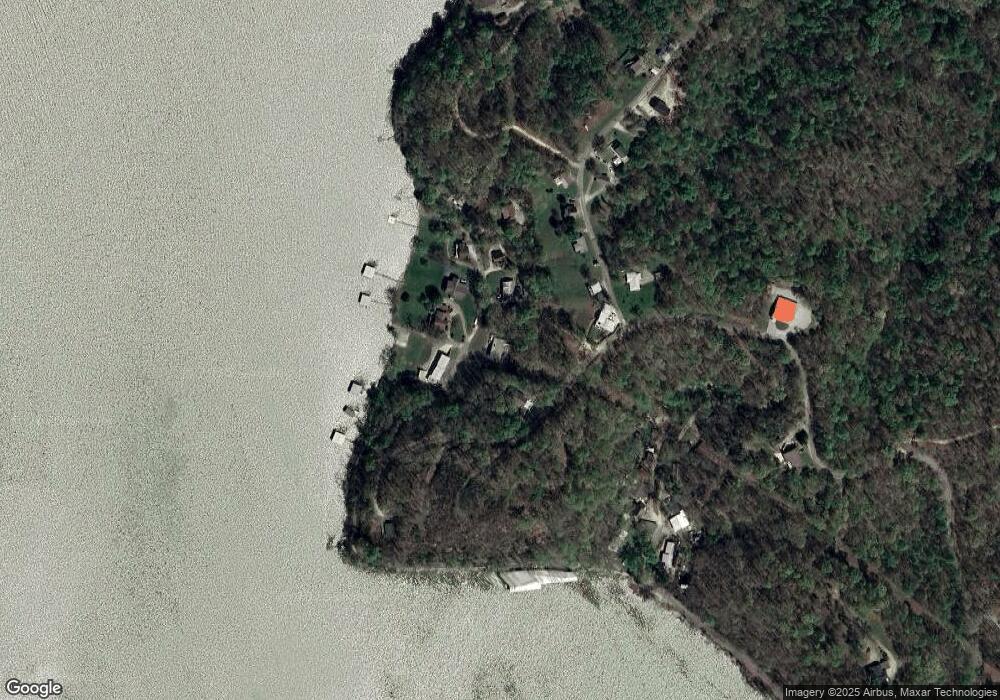
Map
Nearby Homes
- 0 Bass Ln Unit RTC2897238
- 785 Big Richland Dr
- 0 Big Richland Dr Unit RTC2897551
- 0 Big Richland Dr Unit RTC2740467
- 2340 Bear Hollow Dr
- 90 Bluff Point Ln
- 440 Bluff Point Ln
- 97 Camp Cir
- 0 Richland Ridge Rd
- 59 Riverview Ln
- 465 Turtle Point Ln
- 9740 Clydeton Rd
- 9828 Clydeton Rd
- 0 Highwater Rd Unit RTC2964176
- 0 Highwater Rd Unit RTC2944123
- 0 Highwater Rd Unit RTC2882956
- 0 Highwater Rd Unit RTC2662077
- 0 Highwater Rd Unit RTC2647801
- 0 Highwater Rd Unit RTC2640981
- 0 Highwater Rd Unit RTC2640973
- 805 Lakestone Dr
- 137 Lakeland Rd
- 5856 W Little Richland Rd
- 5827 W Little Richland Rd
- 5801 W Little Richland Rd
- 5845 W Little Richland Rd
- 5881 W Little Richland Rd
- 475 Big Richland Dr
- 499 Big Richland Dr
- 5900 W Little Richland Rd
- 527 Big Richland Dr
- 0 Lakeland Rd
- 545 Big Richland Dr
- 81 Calvin St
- 498 Big Richland Dr
- 565 Big Richland Dr
- 5911 W Little Richland Rd
- 0 Bass Ln
- 0 Bass Ln Unit RTC2505191
- 0 Bass Ln Unit RTC2050231