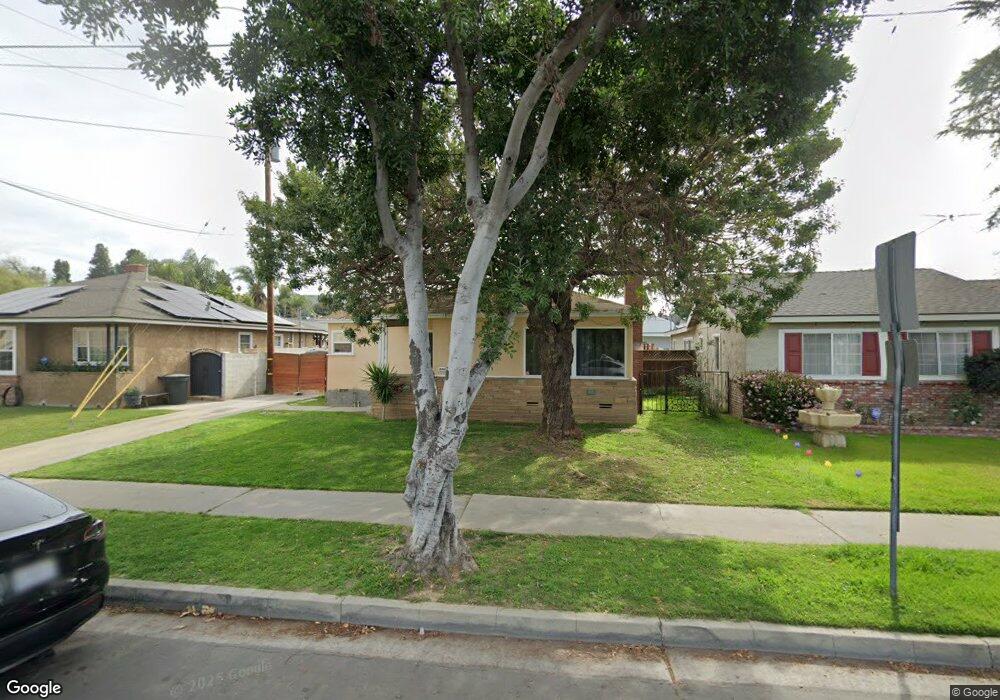
5828 El Rancho Dr Whittier, CA 90606
West Whittier NeighborhoodEstimated Value: $735,765 - $764,000
2
Beds
1
Bath
1,075
Sq Ft
$699/Sq Ft
Est. Value
About This Home
This home is located at 5828 El Rancho Dr, Whittier, CA 90606 and is currently estimated at $751,691, approximately $699 per square foot. 5828 El Rancho Dr is a home located in Los Angeles County with nearby schools including Longfellow Elementary School, Walter F. Dexter Middle School, and Whittier High School.
Ownership History
Date
Name
Owned For
Owner Type
Purchase Details
Closed on
May 16, 1996
Sold by
Occidental Mtg Corp
Bought by
Gutierrez Richard and Gutierrez Sonia
Current Estimated Value
Home Financials for this Owner
Home Financials are based on the most recent Mortgage that was taken out on this home.
Original Mortgage
$145,207
Interest Rate
8.03%
Mortgage Type
FHA
Purchase Details
Closed on
Jan 18, 1996
Sold by
Penilla Denise Rose and Occidential Mtg Corp
Bought by
Occidental Mtg Corp
Purchase Details
Closed on
Jun 30, 1994
Sold by
Gress Christina
Bought by
Penilla Denise Rose
Home Financials for this Owner
Home Financials are based on the most recent Mortgage that was taken out on this home.
Original Mortgage
$153,900
Interest Rate
8.51%
Purchase Details
Closed on
Mar 2, 1994
Sold by
Gress David
Bought by
Gress Christina
Create a Home Valuation Report for This Property
The Home Valuation Report is an in-depth analysis detailing your home's value as well as a comparison with similar homes in the area
Home Values in the Area
Average Home Value in this Area
Purchase History
| Date | Buyer | Sale Price | Title Company |
|---|---|---|---|
| Gutierrez Richard | $148,000 | Continental Lawyers Title Co | |
| Occidental Mtg Corp | $155,000 | United Title Company | |
| Penilla Denise Rose | $162,000 | American Title Company | |
| Gress Christina | -- | -- |
Source: Public Records
Mortgage History
| Date | Status | Borrower | Loan Amount |
|---|---|---|---|
| Previous Owner | Gutierrez Richard | $145,207 | |
| Previous Owner | Penilla Denise Rose | $153,900 |
Source: Public Records
Tax History Compared to Growth
Tax History
| Year | Tax Paid | Tax Assessment Tax Assessment Total Assessment is a certain percentage of the fair market value that is determined by local assessors to be the total taxable value of land and additions on the property. | Land | Improvement |
|---|---|---|---|---|
| 2025 | $3,353 | $240,693 | $140,543 | $100,150 |
| 2024 | $3,353 | $235,975 | $137,788 | $98,187 |
| 2023 | $3,304 | $231,349 | $135,087 | $96,262 |
| 2022 | $3,266 | $226,814 | $132,439 | $94,375 |
| 2021 | $3,192 | $222,368 | $129,843 | $92,525 |
| 2019 | $3,132 | $215,775 | $125,993 | $89,782 |
| 2018 | $2,972 | $211,545 | $123,523 | $88,022 |
| 2016 | $2,821 | $203,332 | $118,727 | $84,605 |
| 2015 | $2,786 | $200,279 | $116,944 | $83,335 |
| 2014 | $2,753 | $196,357 | $114,654 | $81,703 |
Source: Public Records
Map
Nearby Homes
- 11273 Dorland Dr
- 11232 Dorland Dr
- 11447 Broadway Ave
- 11302 Maple St
- 6225 Gretna Ave
- 6266 Western Ave
- 6240 Gretna Ave
- 11905 Mendenhall Ln
- 6222 Magnolia Ave
- 12031 Beverly Blvd Unit 1D
- 10825 Loch Avon Dr
- 10943 Loch Lomond Dr
- 11840 Nixon Ln
- 5518 Norwalk Blvd
- 5903 Redman Ave
- 11567 Keith Dr
- 11730 Whittier Blvd Unit 27
- 11730 Whittier Blvd Unit 39
- 11730 Whittier Blvd Unit 54
- 11730 Whittier Blvd Unit 55
- 5822 El Rancho Dr
- 5832 El Rancho Dr
- 11313 Howard St
- 5816 El Rancho Dr
- 11314 Orange Dr
- 11319 Howard St
- 11320 Orange Dr
- 5902 El Rancho Dr
- 5831 El Rancho Dr
- 11325 Howard St
- 5808 El Rancho Dr
- 5810 Orange Place
- 11312 Howard St
- 5837 El Rancho Dr
- 11326 Orange Dr
- 5908 El Rancho Dr
- 5812 Orange Place
- 11313 Orange Dr
- 5806 Orange Place
- 11329 Howard St