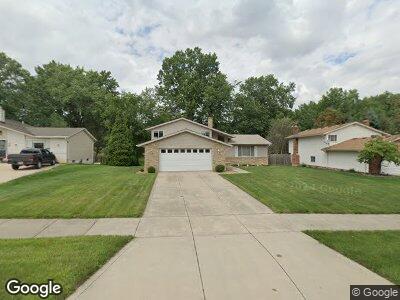
5828 N Crossview Rd Seven Hills, OH 44131
Estimated Value: $301,862 - $369,000
3
Beds
2
Baths
2,112
Sq Ft
$155/Sq Ft
Est. Value
About This Home
This home is located at 5828 N Crossview Rd, Seven Hills, OH 44131 and is currently estimated at $326,716, approximately $154 per square foot. 5828 N Crossview Rd is a home located in Cuyahoga County with nearby schools including John Muir Elementary School, Hillside Middle School, and Normandy High School.
Ownership History
Date
Name
Owned For
Owner Type
Purchase Details
Closed on
Feb 2, 2012
Sold by
Camarato Annette M
Bought by
Camarato Michael A
Current Estimated Value
Purchase Details
Closed on
May 20, 2003
Sold by
Camarato Annette M and Camarato Anthony S
Bought by
Camarato Annette M and Camarato Michael A
Purchase Details
Closed on
Mar 16, 1992
Sold by
Galletti Carmela T
Bought by
Galletti Anthony J
Purchase Details
Closed on
Mar 4, 1992
Sold by
Galletti Anthony J
Bought by
Galletti Carmela T
Purchase Details
Closed on
Dec 15, 1983
Sold by
Galletti Anthony J
Bought by
Galletti Anthony J
Purchase Details
Closed on
Apr 25, 1980
Bought by
Galletti Anthony J
Purchase Details
Closed on
Nov 18, 1977
Bought by
D C Winslow Const Co
Purchase Details
Closed on
May 9, 1977
Bought by
Central Land Corp
Purchase Details
Closed on
Jan 1, 1975
Bought by
Ludwinski Margaret
Create a Home Valuation Report for This Property
The Home Valuation Report is an in-depth analysis detailing your home's value as well as a comparison with similar homes in the area
Home Values in the Area
Average Home Value in this Area
Purchase History
| Date | Buyer | Sale Price | Title Company |
|---|---|---|---|
| Camarato Michael A | -- | Attorney | |
| Galletti Anthony J | -- | -- | |
| Galletti Carmela T | -- | -- | |
| Galletti Anthony J | -- | -- | |
| Galletti Anthony J | $87,100 | -- | |
| D C Winslow Const Co | -- | -- | |
| Central Land Corp | -- | -- | |
| Suburbia Investment Inc | $50,000 | -- | |
| Ludwinski Margaret | -- | -- |
Source: Public Records
Tax History Compared to Growth
Tax History
| Year | Tax Paid | Tax Assessment Tax Assessment Total Assessment is a certain percentage of the fair market value that is determined by local assessors to be the total taxable value of land and additions on the property. | Land | Improvement |
|---|---|---|---|---|
| 2024 | $5,441 | $90,020 | $15,960 | $74,060 |
| 2023 | $5,456 | $77,280 | $13,510 | $63,770 |
| 2022 | $5,426 | $77,280 | $13,510 | $63,770 |
| 2021 | $5,590 | $77,280 | $13,510 | $63,770 |
| 2020 | $5,127 | $62,830 | $10,990 | $51,840 |
| 2019 | $4,893 | $179,500 | $31,400 | $148,100 |
| 2018 | $4,765 | $62,830 | $10,990 | $51,840 |
| 2017 | $4,841 | $57,580 | $10,150 | $47,430 |
| 2016 | $4,806 | $57,580 | $10,150 | $47,430 |
| 2015 | $4,476 | $57,580 | $10,150 | $47,430 |
| 2014 | $4,476 | $55,900 | $9,870 | $46,030 |
Source: Public Records
Map
Nearby Homes
- 6014 Crossview Rd
- 1700 S Circle View Dr
- Lot C Lombardo Center
- 594 Longridge Dr
- 614 E Parkleigh Dr
- 6135 Meadview Dr
- 252 E Hillsdale Ave
- 6247 Carlyle Dr
- 6313 Gale Dr
- 6372 Tanglewood Ln
- 0 Acorn Dr Unit 5023848
- 1329 E Schaaf Rd
- 5589 Rainier Ct Unit 164
- 1422 Lorimer Rd
- 196 E Ridgewood Dr
- 5651 Broadview Rd Unit A1
- 1805 Keystone Rd
- 1599 Wexford Ave
- 1709 Tuxedo Ave
- 2205 Keystone Rd
- 5828 N Crossview Rd
- 5820 N Crossview Rd
- 5836 N Crossview Rd
- 5810 N Crossview Rd
- 5840 N Crossview Rd
- 5817 Kuenzer Dr
- 5809 Kuenzer Dr
- 5825 Kuenzer Dr
- 5790 N Crossview Rd
- 5850 N Crossview Rd
- 5827 N Crossview Rd
- 5833 Kuenzer Dr
- 5817 N Crossview Dr
- 5817 N Crossview Rd
- 5835 N Crossview Rd
- 5845 N Crossview Rd
- 5780 N Crossview Rd
- 5805 N Crossview Rd
- 5841 Kuenzer Dr
- 5793 Kuenzer Dr