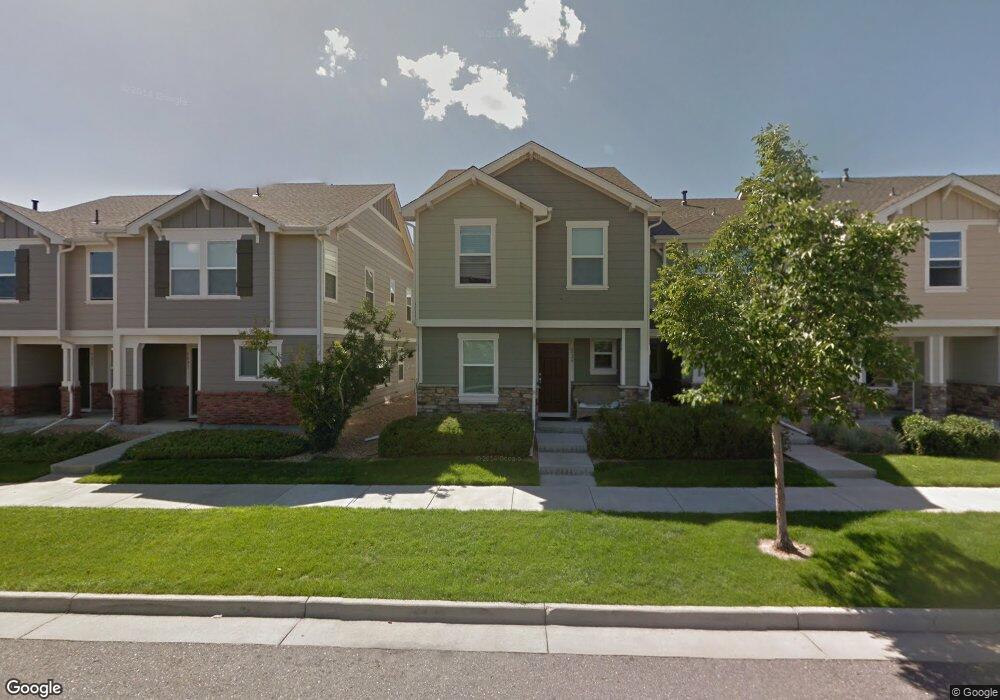
5829 Ceylon St Denver, CO 80249
Estimated Value: $348,000 - $424,000
4
Beds
3
Baths
1,583
Sq Ft
$246/Sq Ft
Est. Value
About This Home
This home is located at 5829 Ceylon St, Denver, CO 80249 and is currently estimated at $389,386, approximately $245 per square foot. 5829 Ceylon St is a home located in Denver County with nearby schools including Pitt-Waller K-8 School, McGlone Academy, and Marie L. Greenwood Academy.
Ownership History
Date
Name
Owned For
Owner Type
Purchase Details
Closed on
Feb 14, 2018
Sold by
Betacourt Pablo R and Betacourt Irma L
Bought by
Wilson Lynn S
Current Estimated Value
Home Financials for this Owner
Home Financials are based on the most recent Mortgage that was taken out on this home.
Original Mortgage
$285,400
Outstanding Balance
$241,465
Interest Rate
3.95%
Mortgage Type
New Conventional
Estimated Equity
$147,921
Purchase Details
Closed on
Feb 6, 2015
Sold by
Betancourt Pablo R and Betancourt Irma
Bought by
Betancourt Pablo R and Betancourt Irma L
Home Financials for this Owner
Home Financials are based on the most recent Mortgage that was taken out on this home.
Original Mortgage
$136,316
Interest Rate
4.25%
Mortgage Type
FHA
Purchase Details
Closed on
Dec 23, 2008
Sold by
Kb Home Colorado Inc
Bought by
Betancourt Pablo R and Betancourt Irma
Home Financials for this Owner
Home Financials are based on the most recent Mortgage that was taken out on this home.
Original Mortgage
$147,682
Interest Rate
6.08%
Mortgage Type
FHA
Create a Home Valuation Report for This Property
The Home Valuation Report is an in-depth analysis detailing your home's value as well as a comparison with similar homes in the area
Home Values in the Area
Average Home Value in this Area
Purchase History
| Date | Buyer | Sale Price | Title Company |
|---|---|---|---|
| Wilson Lynn S | $295,000 | Chicago Title | |
| Betancourt Pablo R | -- | Heritage Title | |
| Betancourt Pablo R | $150,000 | Security Title |
Source: Public Records
Mortgage History
| Date | Status | Borrower | Loan Amount |
|---|---|---|---|
| Open | Wilson Lynn S | $285,400 | |
| Previous Owner | Betancourt Pablo R | $136,316 | |
| Previous Owner | Betancourt Pablo R | $147,682 |
Source: Public Records
Tax History Compared to Growth
Tax History
| Year | Tax Paid | Tax Assessment Tax Assessment Total Assessment is a certain percentage of the fair market value that is determined by local assessors to be the total taxable value of land and additions on the property. | Land | Improvement |
|---|---|---|---|---|
| 2024 | $2,281 | $24,110 | $2,490 | $21,620 |
| 2023 | $2,254 | $24,110 | $2,490 | $21,620 |
| 2022 | $2,114 | $22,130 | $2,730 | $19,400 |
| 2021 | $2,063 | $22,770 | $2,810 | $19,960 |
| 2020 | $1,877 | $20,810 | $2,810 | $18,000 |
| 2019 | $1,834 | $20,810 | $2,810 | $18,000 |
| 2018 | $1,501 | $16,080 | $2,350 | $13,730 |
| 2017 | $1,498 | $16,080 | $2,350 | $13,730 |
| 2016 | $1,270 | $13,020 | $868 | $12,152 |
| 2015 | $1,226 | $13,020 | $868 | $12,152 |
| 2014 | $993 | $10,020 | $852 | $9,168 |
Source: Public Records
Map
Nearby Homes
- 19043 E 58th Ave
- 9372 Ceylon St
- 18761 E 58th Ave Unit A
- 18717 E 57th Place Unit B
- 18947 E 57th Place
- 5850 Ceylon St Unit D
- 5798 Biscay St
- 5888 Biscay St Unit B
- 5888 Biscay St Unit D
- 18986 E 57th Place Unit A
- 5758 Biscay St
- 5793 Biscay St
- 5800 Tower Rd Unit 305
- 5800 Tower Rd Unit 610
- 5800 Tower Rd Unit 505
- 5800 Tower Rd Unit 1201
- 19047 Randolph Place
- 19681 E 59th Place
- 19155 Robins Dr
- 19680 E 59th Dr
- 5829 Ceylon St Unit 5774
- 5823 Ceylon St
- 5833 Ceylon St
- 5821 Ceylon St
- 5839 Ceylon St
- 5819 Ceylon St
- 5841 Ceylon St
- 5811 Ceylon St
- 5843 Ceylon St
- 19069 E 58th Ave
- 5809 Ceylon St
- 19063 E 58th Ave
- 19073 E 58th Ave
- 19061 E 58th Ave
- 19071 E 58th Ave
- 19059 E 58th Ave
- 19079 E 58th Ave
- 5803 Ceylon St
- 19053 E 58th Ave
- 19081 E 58th Ave