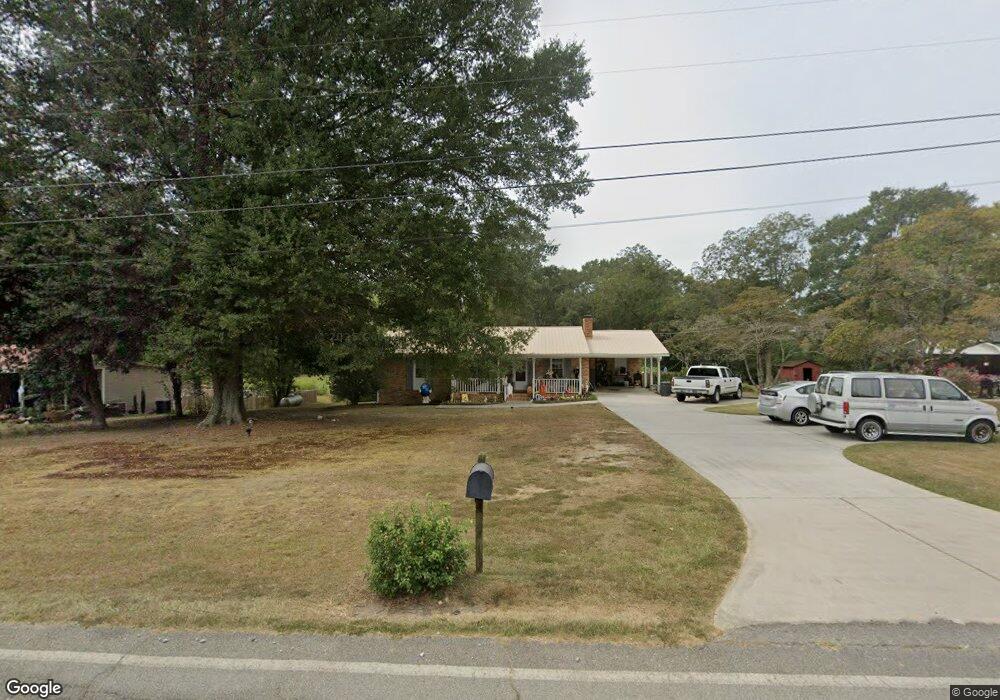
583 Dixson Rd Bowdon, GA 30108
Estimated Value: $296,000 - $424,000
3
Beds
2
Baths
1,789
Sq Ft
$187/Sq Ft
Est. Value
About This Home
This home is located at 583 Dixson Rd, Bowdon, GA 30108 and is currently estimated at $334,231, approximately $186 per square foot. 583 Dixson Rd is a home located in Carroll County with nearby schools including Bowdon Elementary School, Bowdon Middle School, and Bowdon High School.
Ownership History
Date
Name
Owned For
Owner Type
Purchase Details
Closed on
Jul 25, 2019
Sold by
Milam Christopher M
Bought by
Weaver Haley L
Current Estimated Value
Home Financials for this Owner
Home Financials are based on the most recent Mortgage that was taken out on this home.
Original Mortgage
$175,266
Outstanding Balance
$153,844
Interest Rate
4.12%
Mortgage Type
FHA
Estimated Equity
$180,387
Purchase Details
Closed on
Nov 3, 2014
Sold by
Belle Mark
Bought by
Milam Christopher M
Home Financials for this Owner
Home Financials are based on the most recent Mortgage that was taken out on this home.
Original Mortgage
$98,090
Interest Rate
4.25%
Mortgage Type
FHA
Purchase Details
Closed on
May 22, 2003
Sold by
Belle Mark and Belle Jan
Bought by
Belle Mark
Purchase Details
Closed on
Mar 3, 2000
Sold by
Mccormick
Bought by
Belle Mark and Belle Jan
Purchase Details
Closed on
Feb 12, 1977
Bought by
Mccormick
Create a Home Valuation Report for This Property
The Home Valuation Report is an in-depth analysis detailing your home's value as well as a comparison with similar homes in the area
Purchase History
| Date | Buyer | Sale Price | Title Company |
|---|---|---|---|
| Weaver Haley L | $178,500 | -- | |
| Milam Christopher M | $99,000 | -- | |
| Belle Mark | -- | -- | |
| Belle Mark | -- | -- | |
| Belle Mark | $96,900 | -- | |
| Mccormick | -- | -- |
Source: Public Records
Mortgage History
| Date | Status | Borrower | Loan Amount |
|---|---|---|---|
| Open | Weaver Haley L | $175,266 | |
| Previous Owner | Milam Christopher M | $98,090 |
Source: Public Records
Tax History
| Year | Tax Paid | Tax Assessment Tax Assessment Total Assessment is a certain percentage of the fair market value that is determined by local assessors to be the total taxable value of land and additions on the property. | Land | Improvement |
|---|---|---|---|---|
| 2025 | $2,256 | $100,869 | $26,204 | $74,665 |
| 2024 | $2,282 | $100,869 | $26,204 | $74,665 |
| 2023 | $2,282 | $89,566 | $20,964 | $68,602 |
| 2022 | $1,731 | $69,009 | $13,976 | $55,033 |
| 2021 | $1,518 | $59,196 | $11,180 | $48,016 |
| 2020 | $1,350 | $52,578 | $10,164 | $42,414 |
| 2019 | $1,126 | $43,514 | $10,164 | $33,350 |
| 2018 | $932 | $35,489 | $5,031 | $30,458 |
| 2017 | $935 | $35,489 | $5,031 | $30,458 |
| 2016 | $935 | $35,489 | $5,031 | $30,458 |
| 2015 | $815 | $29,146 | $8,304 | $20,842 |
| 2014 | $706 | $29,146 | $8,304 | $20,842 |
Source: Public Records
Map
Nearby Homes
- 112 Scarlett Place Dr
- 112 Scarlett Place Dr Unit 36
- 313 Melanie Ct
- 313 Melanie Ct Unit 26
- 309 Melanie Ct Unit 25
- 309 Melanie Ct
- 152 Scarlett Place Dr
- 152 Scarlett Place Dr Unit 22
- 216 Rhett Dr Unit 12
- 216 Rhett Dr
- 110 Lilly Valley Rd
- 460 Sally Ann Cir
- 400/460 Sally Ann Cir
- 427 E College St
- 6.41 ac N Carroll St & Ave W
- 0 Magnolia St Unit 7657311
- 0 Magnolia St Unit 10614572
- 257 N Carroll St
- 0 Hwy 100 Unit LotWP001 24911780
- 0 Hwy 100 Unit 10541558
- 583 Dixon Rd
- 595 Dixon Rd
- 571 Dixon Rd
- 611 Dixon Rd
- 435 Smith Ave
- 566 Dixon Rd
- 629 Dixon Rd
- 424 Smith Ave
- 521 Dixon Rd
- 0 Craven Rd Unit T5 8293804
- 0 Craven Rd Unit T4 8293801
- 0 Craven Rd Unit T2 8251220
- 0 Craven Rd Unit T1 8251218
- 0 Craven Rd Unit T3 8251222
- 0 Craven Rd Unit 10025979
- 0 Craven Rd Unit 7160697
- 0 Craven Rd Unit 8100905
- 0 Craven Rd Unit 8803723
- 483 Dixon Rd
- 394 Smith Ave
Your Personal Tour Guide
Ask me questions while you tour the home.