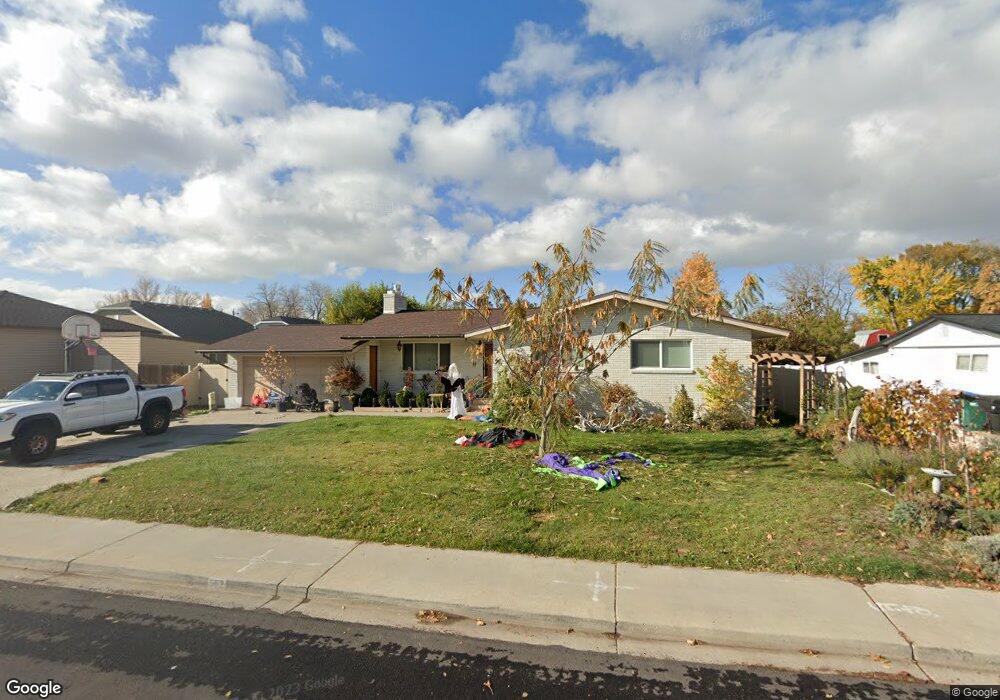
583 N 800 W Orem, UT 84057
Geneva NeighborhoodEstimated Value: $546,000 - $636,000
4
Beds
2
Baths
3,078
Sq Ft
$188/Sq Ft
Est. Value
About This Home
This home is located at 583 N 800 W, Orem, UT 84057 and is currently estimated at $578,225, approximately $187 per square foot. 583 N 800 W is a home located in Utah County with nearby schools including Orem Junior High School, Timpanogos High School, and Karl Maeser Preparatory Academy.
Ownership History
Date
Name
Owned For
Owner Type
Purchase Details
Closed on
Dec 12, 2020
Sold by
Scott Chandler and Scott Jesica
Bought by
Macasio Jeanny and Macasio Michael Siqui
Current Estimated Value
Home Financials for this Owner
Home Financials are based on the most recent Mortgage that was taken out on this home.
Original Mortgage
$396,450
Outstanding Balance
$352,959
Interest Rate
2.7%
Mortgage Type
New Conventional
Estimated Equity
$225,266
Purchase Details
Closed on
Jul 28, 2015
Sold by
Thompson Chad J and Thompson Kristine
Bought by
Benson John
Purchase Details
Closed on
Dec 11, 2002
Sold by
Bullough Bradford R and Bullough Heather S
Bought by
Thompson Chad J and Thompson Kristine
Home Financials for this Owner
Home Financials are based on the most recent Mortgage that was taken out on this home.
Original Mortgage
$147,800
Interest Rate
6.06%
Mortgage Type
Seller Take Back
Create a Home Valuation Report for This Property
The Home Valuation Report is an in-depth analysis detailing your home's value as well as a comparison with similar homes in the area
Home Values in the Area
Average Home Value in this Area
Purchase History
| Date | Buyer | Sale Price | Title Company |
|---|---|---|---|
| Macasio Jeanny | -- | Vanguard Title Insurance Age | |
| Benson John | -- | Richland Title Ins Agen | |
| Thompson Chad J | -- | Title West Title Co |
Source: Public Records
Mortgage History
| Date | Status | Borrower | Loan Amount |
|---|---|---|---|
| Open | Macasio Jeanny | $396,450 | |
| Previous Owner | Thompson Chad J | $147,800 |
Source: Public Records
Tax History
| Year | Tax Paid | Tax Assessment Tax Assessment Total Assessment is a certain percentage of the fair market value that is determined by local assessors to be the total taxable value of land and additions on the property. | Land | Improvement |
|---|---|---|---|---|
| 2025 | $2,371 | $295,515 | -- | -- |
| 2024 | $2,371 | $289,905 | $0 | $0 |
| 2023 | $2,215 | $291,060 | $0 | $0 |
| 2022 | $2,140 | $272,415 | $0 | $0 |
| 2021 | $1,904 | $367,100 | $130,000 | $237,100 |
| 2020 | $1,763 | $334,200 | $104,000 | $230,200 |
| 2019 | $1,672 | $329,500 | $104,000 | $225,500 |
| 2018 | $1,615 | $304,200 | $100,000 | $204,200 |
| 2017 | $1,448 | $146,080 | $0 | $0 |
| 2016 | $1,370 | $127,435 | $0 | $0 |
| 2015 | $1,302 | $114,510 | $0 | $0 |
| 2014 | $1,249 | $109,395 | $0 | $0 |
Source: Public Records
Map
Nearby Homes
- 875 W 530 N
- 557 N Emery Ave
- 776 W 640 N
- 489 N Beverly Ave
- 686 N 835 W
- 474 N Emery Ave
- 954 W 630 N Unit 34,
- 574 N 600 W
- 1058 W 570 St N
- 663 N 550 W
- 1094 W 465 N
- 645 W 920 N
- 222 N 1200 W Unit 144
- 222 N 1200 W Unit 53
- 222 N 1200 W Unit 84
- 930 N 980 W
- 454 N 1235 W
- 1015 N 995 W
- 342 W 350 N
- 1140 W 950 N Unit D302
Your Personal Tour Guide
Ask me questions while you tour the home.