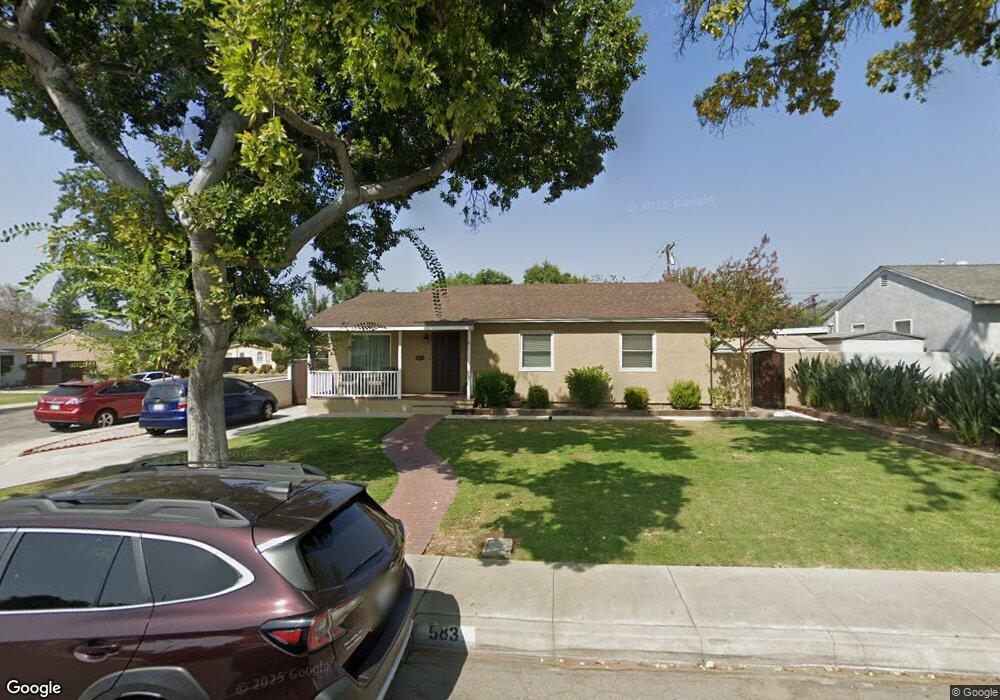
583 N Tulare Way Upland, CA 91786
Estimated Value: $656,000 - $788,000
3
Beds
1
Bath
1,713
Sq Ft
$417/Sq Ft
Est. Value
About This Home
This home is located at 583 N Tulare Way, Upland, CA 91786 and is currently estimated at $714,625, approximately $417 per square foot. 583 N Tulare Way is a home located in San Bernardino County with nearby schools including Baldy View Elementary School, Upland Junior High School, and Upland High School.
Ownership History
Date
Name
Owned For
Owner Type
Purchase Details
Closed on
May 18, 2021
Sold by
Scott Shelby M and Scott Lois G
Bought by
Scott Shelby M and Scott Lois G
Current Estimated Value
Purchase Details
Closed on
Mar 25, 2004
Sold by
Scott Shelby M
Bought by
Scott Shelby M and Scott Lois G
Purchase Details
Closed on
Sep 16, 1997
Sold by
Jones Scott E
Bought by
Scott Shelby M and Scott Lois G
Home Financials for this Owner
Home Financials are based on the most recent Mortgage that was taken out on this home.
Original Mortgage
$104,000
Outstanding Balance
$16,146
Interest Rate
7.49%
Estimated Equity
$698,479
Purchase Details
Closed on
Jul 20, 1997
Sold by
Serrao Joseph J & Eugenia R Trust and Joyce Marie
Bought by
Jones Scott E and Minnis Jones Valerie
Home Financials for this Owner
Home Financials are based on the most recent Mortgage that was taken out on this home.
Original Mortgage
$104,000
Outstanding Balance
$16,146
Interest Rate
7.49%
Estimated Equity
$698,479
Create a Home Valuation Report for This Property
The Home Valuation Report is an in-depth analysis detailing your home's value as well as a comparison with similar homes in the area
Home Values in the Area
Average Home Value in this Area
Purchase History
| Date | Buyer | Sale Price | Title Company |
|---|---|---|---|
| Scott Shelby M | -- | None Available | |
| Scott Shelby M | -- | -- | |
| Scott Shelby M | $130,000 | Orange Coast Title | |
| Jones Scott E | $90,000 | Orange Coast Title |
Source: Public Records
Mortgage History
| Date | Status | Borrower | Loan Amount |
|---|---|---|---|
| Open | Scott Shelby M | $104,000 |
Source: Public Records
Tax History Compared to Growth
Tax History
| Year | Tax Paid | Tax Assessment Tax Assessment Total Assessment is a certain percentage of the fair market value that is determined by local assessors to be the total taxable value of land and additions on the property. | Land | Improvement |
|---|---|---|---|---|
| 2025 | $2,283 | $207,578 | $71,856 | $135,722 |
| 2024 | $2,283 | $203,508 | $70,447 | $133,061 |
| 2023 | $2,245 | $199,518 | $69,066 | $130,452 |
| 2022 | $2,195 | $195,606 | $67,712 | $127,894 |
| 2021 | $2,188 | $191,770 | $66,384 | $125,386 |
| 2020 | $2,202 | $189,803 | $65,703 | $124,100 |
| 2019 | $2,196 | $186,082 | $64,415 | $121,667 |
| 2018 | $2,145 | $182,433 | $63,152 | $119,281 |
| 2017 | $2,083 | $178,856 | $61,914 | $116,942 |
| 2016 | $1,952 | $175,349 | $60,700 | $114,649 |
| 2015 | $1,857 | $172,715 | $59,788 | $112,927 |
| 2014 | $1,809 | $169,332 | $58,617 | $110,715 |
Source: Public Records
Map
Nearby Homes
- 435 W 9th St Unit F5
- 435 W 9th St Unit B3
- 537 W 9th St
- 855 N Palm Ave
- 910 N Redding Way Unit F
- 928 N Redding Way Unit D
- 125 Towns Ave
- 0 Bay St Unit AR25093919
- 595 Juniper Ave
- 164 Euclid Place
- 681 Birch Ave
- Plan 3 at Towns on First - Towns On First
- Plan 4 at Towns on First - Towns On First
- 119 N 1st Ave
- 691 N 3rd Ave
- 173 W 8th St
- 228 Greentree Rd
- 173 Elizabeth Ln
- 1234 N Laurel Ave
- 939 W Pine St Unit 44