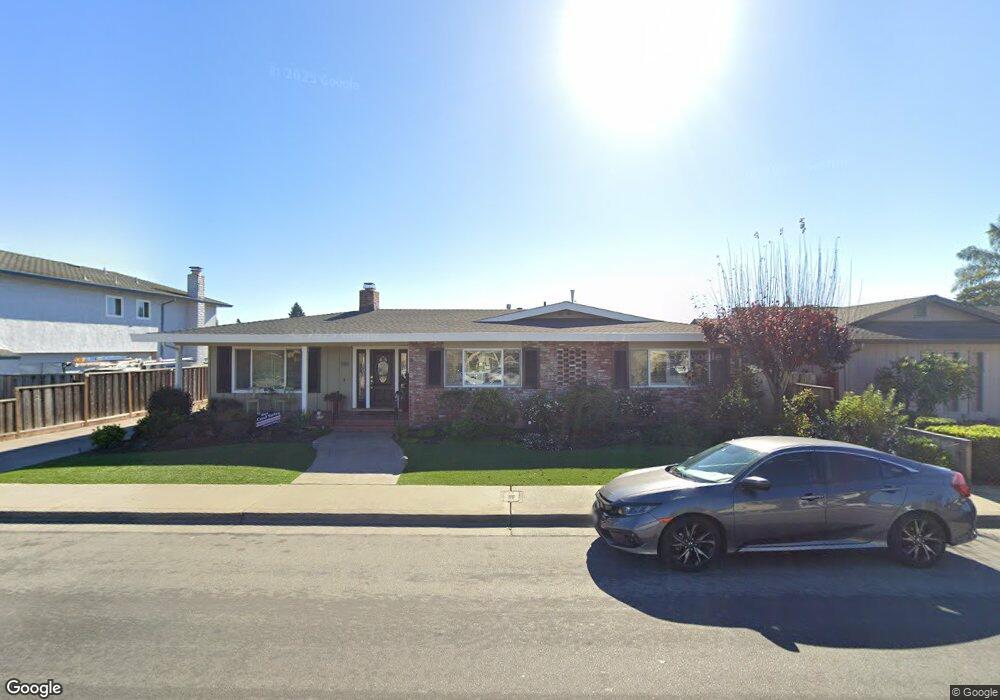
583 Tuttle Ave Watsonville, CA 95076
Estimated Value: $635,000 - $1,053,000
3
Beds
2
Baths
2,106
Sq Ft
$414/Sq Ft
Est. Value
About This Home
This home is located at 583 Tuttle Ave, Watsonville, CA 95076 and is currently estimated at $872,246, approximately $414 per square foot. 583 Tuttle Ave is a home located in Santa Cruz County with nearby schools including Ann Soldo Elementary School, Lakeview Middle School, and Watsonville High School.
Ownership History
Date
Name
Owned For
Owner Type
Purchase Details
Closed on
Mar 3, 2021
Sold by
Skillicorn John T and Skillicorn Karen P
Bought by
Skillicorn John T and Skillicorn Karen P
Current Estimated Value
Home Financials for this Owner
Home Financials are based on the most recent Mortgage that was taken out on this home.
Original Mortgage
$475,000
Outstanding Balance
$425,804
Interest Rate
2.7%
Mortgage Type
New Conventional
Estimated Equity
$446,442
Purchase Details
Closed on
Jan 29, 2020
Sold by
Friend Eugene R and Friend Eugene
Bought by
Skillicorn John T and Skillicorn Karen P
Home Financials for this Owner
Home Financials are based on the most recent Mortgage that was taken out on this home.
Original Mortgage
$484,500
Interest Rate
3.74%
Mortgage Type
New Conventional
Purchase Details
Closed on
Sep 4, 2003
Sold by
Friend Eugene R and Friend Shirley R
Bought by
Friend Eugene R and Friend Shirley R
Create a Home Valuation Report for This Property
The Home Valuation Report is an in-depth analysis detailing your home's value as well as a comparison with similar homes in the area
Home Values in the Area
Average Home Value in this Area
Purchase History
| Date | Buyer | Sale Price | Title Company |
|---|---|---|---|
| Skillicorn John T | -- | First American Title Company | |
| Skillicorn John T | $630,000 | First American Title Company | |
| Friend Eugene R | -- | -- |
Source: Public Records
Mortgage History
| Date | Status | Borrower | Loan Amount |
|---|---|---|---|
| Open | Skillicorn John T | $475,000 | |
| Closed | Skillicorn John T | $484,500 |
Source: Public Records
Tax History Compared to Growth
Tax History
| Year | Tax Paid | Tax Assessment Tax Assessment Total Assessment is a certain percentage of the fair market value that is determined by local assessors to be the total taxable value of land and additions on the property. | Land | Improvement |
|---|---|---|---|---|
| 2025 | $7,852 | $688,997 | $382,776 | $306,221 |
| 2023 | $7,733 | $662,242 | $367,912 | $294,330 |
| 2022 | $7,597 | $649,258 | $360,699 | $288,559 |
| 2021 | $7,553 | $636,527 | $353,626 | $282,901 |
| 2020 | $1,462 | $121,975 | $21,181 | $100,794 |
| 2019 | $1,435 | $119,583 | $20,765 | $98,818 |
| 2018 | $1,397 | $117,238 | $20,358 | $96,880 |
| 2017 | $1,382 | $114,939 | $19,959 | $94,980 |
| 2016 | $1,345 | $112,686 | $19,568 | $93,118 |
| 2015 | $1,338 | $110,993 | $19,274 | $91,719 |
| 2014 | $1,308 | $108,818 | $18,896 | $89,922 |
Source: Public Records
Map
Nearby Homes