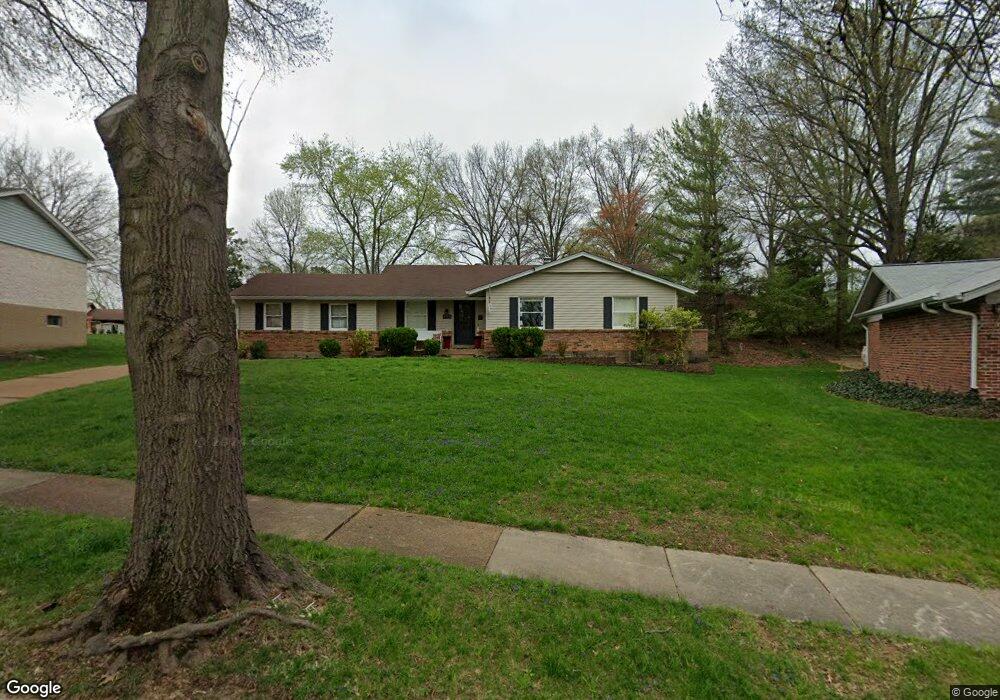
5830 Chrisbrook Dr Saint Louis, MO 63128
Estimated Value: $342,504 - $396,000
3
Beds
3
Baths
1,842
Sq Ft
$195/Sq Ft
Est. Value
About This Home
This home is located at 5830 Chrisbrook Dr, Saint Louis, MO 63128 and is currently estimated at $359,376, approximately $195 per square foot. 5830 Chrisbrook Dr is a home located in St. Louis County with nearby schools including Hagemann Elementary School, Washington Middle School, and Mehlville High School.
Ownership History
Date
Name
Owned For
Owner Type
Purchase Details
Closed on
Mar 25, 2025
Sold by
Hutchcraft Alan and Hutchcraft Carrie
Bought by
Hutchcraft Family Revocable Trust
Current Estimated Value
Purchase Details
Closed on
Jan 12, 2012
Sold by
Parmeley Daniel and Parmeley Jennifer
Bought by
Hutchcraft Alan and Hutchcraft Carrie
Home Financials for this Owner
Home Financials are based on the most recent Mortgage that was taken out on this home.
Original Mortgage
$208,900
Interest Rate
4.03%
Mortgage Type
New Conventional
Purchase Details
Closed on
Jul 19, 2007
Sold by
Iliff Douglas D and Iliff Susan L
Bought by
Parmeley Daniel and Parmeley Jennifer
Home Financials for this Owner
Home Financials are based on the most recent Mortgage that was taken out on this home.
Original Mortgage
$181,500
Interest Rate
6.54%
Mortgage Type
Purchase Money Mortgage
Create a Home Valuation Report for This Property
The Home Valuation Report is an in-depth analysis detailing your home's value as well as a comparison with similar homes in the area
Home Values in the Area
Average Home Value in this Area
Purchase History
| Date | Buyer | Sale Price | Title Company |
|---|---|---|---|
| Hutchcraft Family Revocable Trust | -- | None Listed On Document | |
| Hutchcraft Alan | $219,900 | Title Partners Agency Llc | |
| Parmeley Daniel | $227,000 | Ort |
Source: Public Records
Mortgage History
| Date | Status | Borrower | Loan Amount |
|---|---|---|---|
| Previous Owner | Hutchcraft Alan | $208,900 | |
| Previous Owner | Parmeley Daniel | $181,500 |
Source: Public Records
Tax History Compared to Growth
Tax History
| Year | Tax Paid | Tax Assessment Tax Assessment Total Assessment is a certain percentage of the fair market value that is determined by local assessors to be the total taxable value of land and additions on the property. | Land | Improvement |
|---|---|---|---|---|
| 2025 | $3,514 | $57,110 | $26,600 | $30,510 |
| 2024 | $3,514 | $52,290 | $14,250 | $38,040 |
| 2023 | $3,514 | $52,290 | $14,250 | $38,040 |
| 2022 | $2,817 | $42,600 | $12,350 | $30,250 |
| 2021 | $2,726 | $42,600 | $12,350 | $30,250 |
| 2020 | $2,629 | $39,060 | $10,450 | $28,610 |
| 2019 | $2,621 | $39,060 | $10,450 | $28,610 |
| 2018 | $2,654 | $35,720 | $9,500 | $26,220 |
| 2017 | $2,650 | $35,720 | $9,500 | $26,220 |
| 2016 | $2,636 | $34,090 | $9,500 | $24,590 |
| 2015 | $2,421 | $34,090 | $9,500 | $24,590 |
| 2014 | $2,217 | $30,870 | $6,780 | $24,090 |
Source: Public Records
Map
Nearby Homes
- 5812 Chrisbrook Dr
- 5714 Shining Day Place
- 4523 Beaver Brook Ct
- 5626 Greenton Way
- 6006 Grand Marnier Dr
- 5028 Baldcypress Ct
- 4968 Quail Crest Ct
- 6055 Bayou Bend Ct
- 5952 Shortleaf Ct
- 4716 Medalton Way
- 5942 Hawkins Fuchs Rd
- 5174 Hollow Wood Ct Unit C
- 5100 Hollow Wood Ct Unit D
- 5106 Hollow Wood Ct Unit C
- 5162 Hollow Wood Ct Unit D
- 4251 Green Grove Ct
- 6401 Brookfield Court Dr
- 6401 Brookfield Court Dr Unit 102
- 5417 Morningdale Place
- 5414 Village Courtway Ln
- 5824 Chrisbrook Dr
- 5838 Chrisbrook Dr
- 5827 Kerth Rd
- 5821 Kerth Rd
- 5818 Chrisbrook Dr
- 5844 Chrisbrook Dr
- 5815 Kerth Rd
- 5825 Chrisbrook Dr
- 5833 Kerth Rd
- 5839 Chrisbrook Dr
- 5819 Chrisbrook Dr
- 5809 Kerth Rd
- 5850 Chrisbrook Dr
- 5855 Chrisbrook Dr
- 5811 Chrisbrook Dr
- 5814 Kerth Rd
- 5856 Chrisbrook Dr
- 4642 Markton Dr
- 5806 Chrisbrook Dr
- 4648 Markton Dr