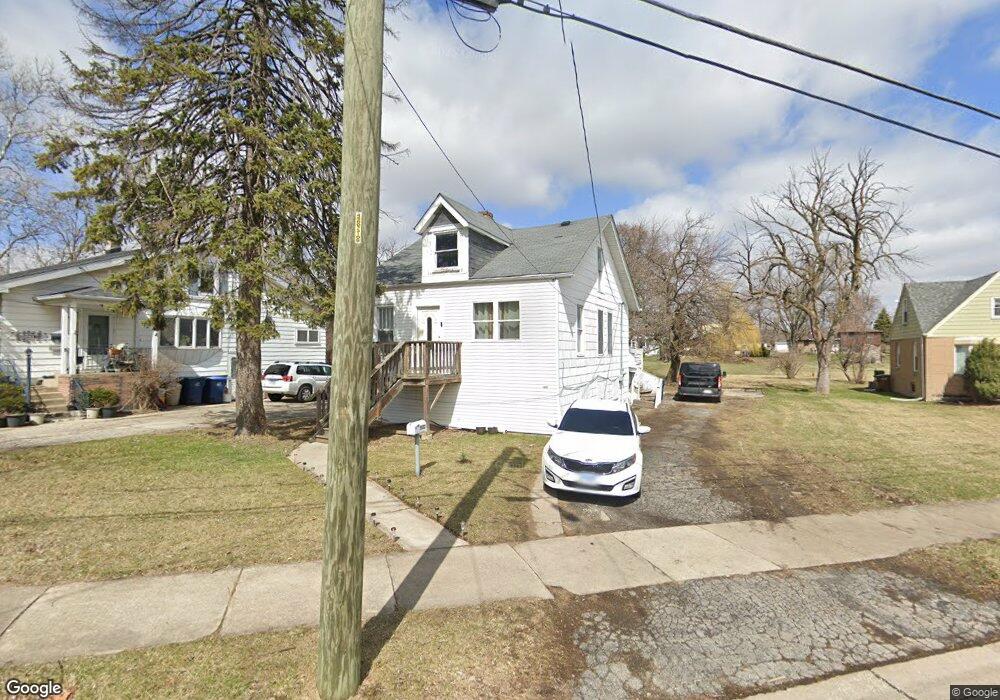
5832 W Elm Ave Berkeley, IL 60163
Estimated Value: $158,000 - $334,000
4
Beds
1
Bath
1,330
Sq Ft
$179/Sq Ft
Est. Value
About This Home
This home is located at 5832 W Elm Ave, Berkeley, IL 60163 and is currently estimated at $238,624, approximately $179 per square foot. 5832 W Elm Ave is a home located in Cook County with nearby schools including Macarthur Intermediate School, Sunnyside Elementary School, and Proviso West High School.
Ownership History
Date
Name
Owned For
Owner Type
Purchase Details
Closed on
Nov 27, 2024
Sold by
Montpas Melody
Bought by
Goodluck Fred
Current Estimated Value
Purchase Details
Closed on
Nov 5, 2024
Sold by
Goodluck Fred
Bought by
Vargas Jiovani Israel and Dominguez Cinthya
Purchase Details
Closed on
Feb 5, 2021
Sold by
Goldberg Donald L
Bought by
Goldberg Donald L and Montpas Melody
Purchase Details
Closed on
Jul 5, 2016
Sold by
Goodluck Fred and Goodluck Lisa
Bought by
Goodluck Fred and Goldberg Donald L
Purchase Details
Closed on
Nov 12, 2013
Sold by
Johnson George and Carollo Edith
Bought by
Goodluck Fred
Purchase Details
Closed on
Feb 28, 2007
Sold by
Johnson Arthur
Bought by
Johnson Arthur and Rubel Arthur
Create a Home Valuation Report for This Property
The Home Valuation Report is an in-depth analysis detailing your home's value as well as a comparison with similar homes in the area
Home Values in the Area
Average Home Value in this Area
Purchase History
| Date | Buyer | Sale Price | Title Company |
|---|---|---|---|
| Goodluck Fred | -- | None Listed On Document | |
| Goodluck Fred | -- | None Listed On Document | |
| Vargas Jiovani Israel | $120,000 | None Listed On Document | |
| Vargas Jiovani Israel | $120,000 | None Listed On Document | |
| Goldberg Donald L | -- | Attorney | |
| Goodluck Fred | -- | Ticor Title Insurance Compan | |
| Goodluck Fred | $30,000 | Premier Title | |
| Johnson Arthur | -- | None Available |
Source: Public Records
Tax History
| Year | Tax Paid | Tax Assessment Tax Assessment Total Assessment is a certain percentage of the fair market value that is determined by local assessors to be the total taxable value of land and additions on the property. | Land | Improvement |
|---|---|---|---|---|
| 2025 | $6,669 | $18,001 | $6,688 | $11,313 |
| 2024 | $6,669 | $18,001 | $6,688 | $11,313 |
| 2023 | $7,287 | $18,001 | $6,688 | $11,313 |
| 2022 | $7,287 | $16,588 | $4,560 | $12,028 |
| 2021 | $7,264 | $16,587 | $4,559 | $12,028 |
| 2020 | $6,850 | $16,587 | $4,559 | $12,028 |
| 2019 | $5,105 | $12,045 | $4,255 | $7,790 |
| 2018 | $5,005 | $12,045 | $4,255 | $7,790 |
| 2017 | $4,784 | $12,045 | $4,255 | $7,790 |
| 2016 | $4,273 | $10,557 | $3,951 | $6,606 |
| 2015 | $4,261 | $10,557 | $3,951 | $6,606 |
| 2014 | $4,184 | $10,557 | $3,951 | $6,606 |
| 2013 | $3,226 | $11,440 | $3,951 | $7,489 |
Source: Public Records
Map
Nearby Homes
- 5949 School St
- 504 N Irving Ave
- 593 S Edgewood Ave
- 2050 Atwood Ave
- 250 N Irving Ave
- 4938 W Randolph St
- 522 E Park Manor Ct
- 1529 N Hillside Ave
- 1447 N Ashbel Ave
- 1428 1/2 N Ashbel Ave
- 515 S Parkview Ave
- 4904 W Hawthorne Ave
- 226 N Lind Ave
- 520 N Wolf Rd Unit 203
- 605 N Wolf Rd Unit B9
- 5706 Saint Charles Rd
- 5700 Saint Charles Rd
- 341 Iroquois Rd
- 956 S Cadwell Ave
- 5905 Superior St
- 5828 W Elm Ave
- 5844 W Elm Ave
- 5842 W Elm Ave
- 1832 Longfellow Ct
- 5826 W Elm Ave
- 1836 Longfellow Ct
- 5848 W Elm Ave
- 5824 W Elm Ave
- 5902 W Elm Ave
- 1840 Longfellow Ct
- Lot 12 Longfellow Ct
- Lot #3 Longfellow Ct
- 5835 W Elm Ave
- 5820 W Elm Ave
- 5841 W Elm Ave
- 1844 Longfellow Ct
- 1825 Longfellow Ct
- 1829 Longfellow Ct
- 5906 W Elm Ave
- 1833 Longfellow Ct
Your Personal Tour Guide
Ask me questions while you tour the home.