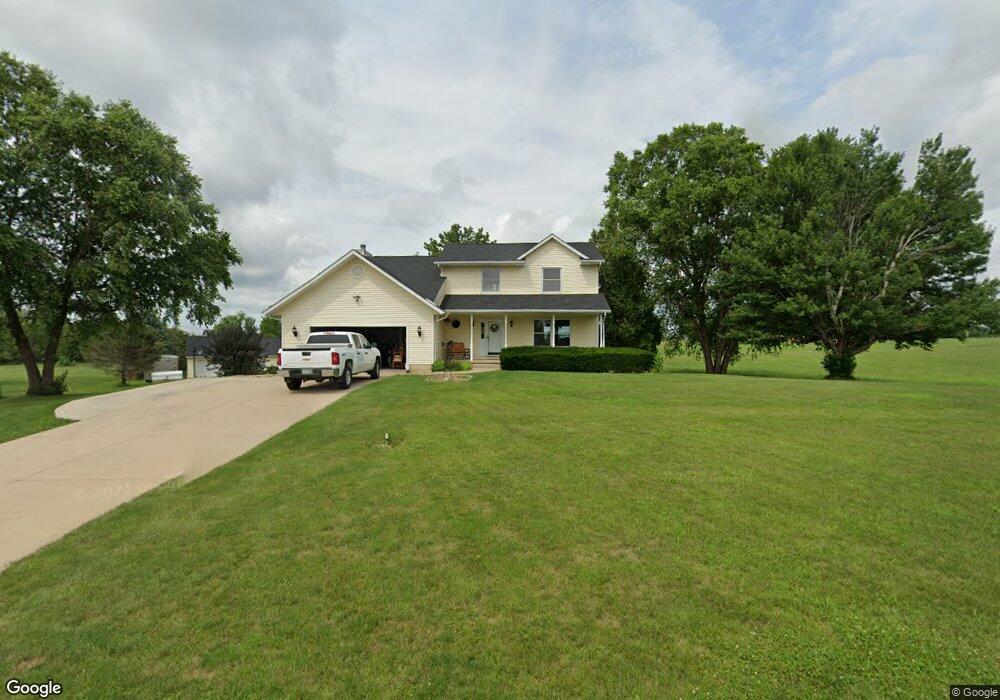
5832 Wells Ln Cedar Rapids, IA 52411
Estimated Value: $384,000 - $471,000
4
Beds
4
Baths
2,116
Sq Ft
$208/Sq Ft
Est. Value
About This Home
This home is located at 5832 Wells Ln, Cedar Rapids, IA 52411 and is currently estimated at $440,104, approximately $207 per square foot. 5832 Wells Ln is a home located in Linn County with nearby schools including Viola Gibson Elementary School, Harding Middle School, and John F. Kennedy High School.
Ownership History
Date
Name
Owned For
Owner Type
Purchase Details
Closed on
Aug 30, 2018
Sold by
Brewer Mark D and Brewer Janice R
Bought by
Branquinho Edward P and Branquinho Denise
Current Estimated Value
Home Financials for this Owner
Home Financials are based on the most recent Mortgage that was taken out on this home.
Original Mortgage
$46,575
Outstanding Balance
$34,844
Interest Rate
4.6%
Mortgage Type
Stand Alone Second
Estimated Equity
$405,260
Purchase Details
Closed on
Feb 14, 2000
Sold by
Dolezal Terry J and Dolezal Joyce M
Bought by
Brewer Mark D and Brewer Janice R
Create a Home Valuation Report for This Property
The Home Valuation Report is an in-depth analysis detailing your home's value as well as a comparison with similar homes in the area
Purchase History
| Date | Buyer | Sale Price | Title Company |
|---|---|---|---|
| Branquinho Edward P | $310,500 | None Available | |
| Brewer Mark D | $208,000 | -- |
Source: Public Records
Mortgage History
| Date | Status | Borrower | Loan Amount |
|---|---|---|---|
| Open | Branquinho Edward P | $46,575 |
Source: Public Records
Tax History
| Year | Tax Paid | Tax Assessment Tax Assessment Total Assessment is a certain percentage of the fair market value that is determined by local assessors to be the total taxable value of land and additions on the property. | Land | Improvement |
|---|---|---|---|---|
| 2025 | $4,560 | $472,400 | $71,500 | $400,900 |
| 2024 | $4,330 | $418,800 | $71,500 | $347,300 |
| 2023 | $4,330 | $418,800 | $71,500 | $347,300 |
| 2022 | $4,278 | $318,700 | $71,500 | $247,200 |
| 2021 | $4,356 | $318,700 | $71,500 | $247,200 |
| 2020 | $4,356 | $287,100 | $52,400 | $234,700 |
| 2019 | $3,828 | $267,400 | $52,400 | $215,000 |
Source: Public Records
Map
Nearby Homes
- 5843 Wells Ln
- 5854 Wells Ln
- 5871 Shiloh Ln
- 6524 Michael Dr NE
- 6718 Lauder Ln
- 6720 Caldwell Ln
- 6505 Blairs Ferry Rd
- 4675 Leprechaun Ln
- 5012 Autumn Dr
- 4362 Cloverdale Rd
- 344 Worthington Ct
- 3012 Prairielight Ct
- 1845 Lyndhurst Dr
- 9243 Feather Ridge Pass
- 2861 Prairielight Dr
- 2870 Grassland Ct
- 2873 Grassland Ct
- 2875 Grassland Ct
- Lot 1A Buffalo Ridge Dr NE
- 2851 Mary Green Rd
- 5840 Wells Ln
- 5835 Wells Ln
- 5823 Wells Ln
- 5860 Wells Ln
- 5840 Shiloh Ln
- 5809 Wells Ln
- 7200 Bettsy Ct
- 5828 Shiloh Ln
- 5874 Wells Ln
- 7317 Milburn Rd
- 7172 Bettsy Ct
- 5858 Shiloh Ln
- 5803 Wells Ln
- 5810 Shiloh Ln
- 6095 Brissa Ln
- 6169 Brissa Ln Unit 6
- 5841 Shiloh Ln
- 5888 Wells Ln
- 6069 Brissa Ln Unit 2
- 6195 Brissa Ln
Your Personal Tour Guide
Ask me questions while you tour the home.