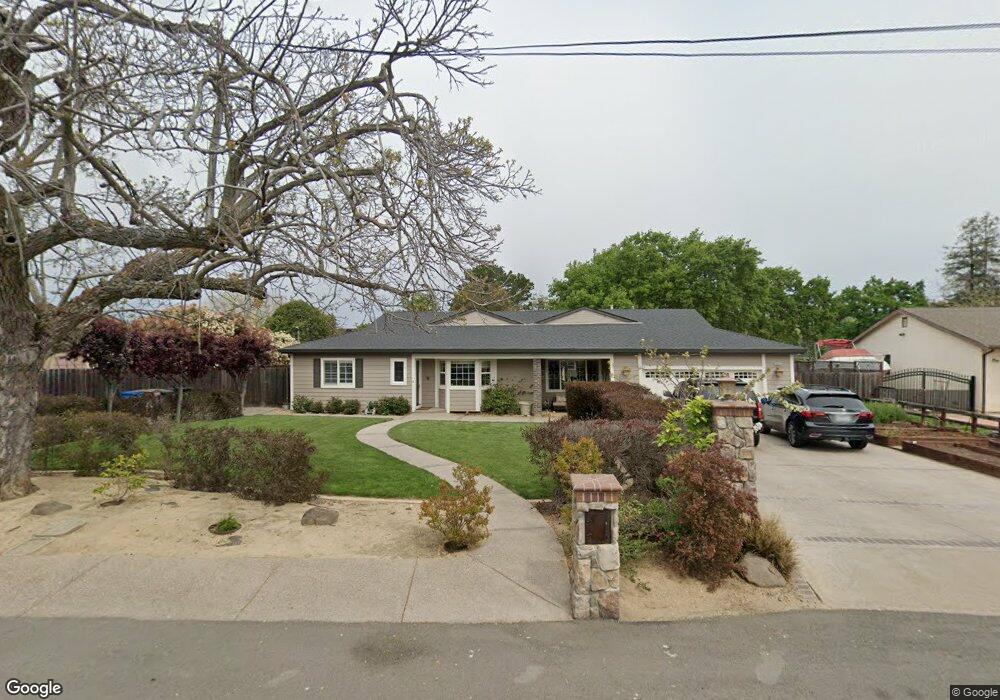
5833 Verna Way E Clayton, CA 94517
Estimated Value: $1,092,000 - $1,496,000
4
Beds
4
Baths
2,591
Sq Ft
$500/Sq Ft
Est. Value
About This Home
This home is located at 5833 Verna Way E, Clayton, CA 94517 and is currently estimated at $1,296,046, approximately $500 per square foot. 5833 Verna Way E is a home located in Contra Costa County with nearby schools including Mt. Diablo Elementary School, Diablo View Middle School, and College Park High School.
Ownership History
Date
Name
Owned For
Owner Type
Purchase Details
Closed on
Feb 13, 2020
Sold by
Dellasantina Michael J and Dellasantina Heather L
Bought by
Dellasantina Michael J and Dellasantina Heather L
Current Estimated Value
Home Financials for this Owner
Home Financials are based on the most recent Mortgage that was taken out on this home.
Original Mortgage
$643,000
Outstanding Balance
$569,331
Interest Rate
3.6%
Mortgage Type
New Conventional
Estimated Equity
$726,715
Purchase Details
Closed on
Oct 28, 2016
Sold by
Pauline Jason and Pauline Cristina
Bought by
Dellasantina Michael and Dellasantina Heather
Home Financials for this Owner
Home Financials are based on the most recent Mortgage that was taken out on this home.
Original Mortgage
$625,500
Interest Rate
3.48%
Mortgage Type
New Conventional
Purchase Details
Closed on
Feb 28, 2000
Sold by
Cotter Mary S
Bought by
Pauline Jason and Pauline Cristina
Home Financials for this Owner
Home Financials are based on the most recent Mortgage that was taken out on this home.
Original Mortgage
$232,000
Interest Rate
3.95%
Mortgage Type
Purchase Money Mortgage
Create a Home Valuation Report for This Property
The Home Valuation Report is an in-depth analysis detailing your home's value as well as a comparison with similar homes in the area
Home Values in the Area
Average Home Value in this Area
Purchase History
| Date | Buyer | Sale Price | Title Company |
|---|---|---|---|
| Dellasantina Michael J | -- | Fidelity National Title Co | |
| Dellasantina Michael | $875,000 | First American Title Company | |
| Pauline Jason | $290,000 | First American Title Guarant |
Source: Public Records
Mortgage History
| Date | Status | Borrower | Loan Amount |
|---|---|---|---|
| Open | Dellasantina Michael J | $643,000 | |
| Closed | Dellasantina Michael | $625,500 | |
| Previous Owner | Pauline Jason | $232,000 |
Source: Public Records
Tax History Compared to Growth
Tax History
| Year | Tax Paid | Tax Assessment Tax Assessment Total Assessment is a certain percentage of the fair market value that is determined by local assessors to be the total taxable value of land and additions on the property. | Land | Improvement |
|---|---|---|---|---|
| 2025 | $12,134 | $1,015,507 | $464,232 | $551,275 |
| 2024 | $11,918 | $995,596 | $455,130 | $540,466 |
| 2023 | $11,918 | $976,075 | $446,206 | $529,869 |
| 2022 | $11,771 | $956,937 | $437,457 | $519,480 |
| 2021 | $11,494 | $938,175 | $428,880 | $509,295 |
| 2019 | $11,278 | $910,350 | $416,160 | $494,190 |
| 2018 | $10,861 | $892,500 | $408,000 | $484,500 |
| 2017 | $10,512 | $875,000 | $400,000 | $475,000 |
| 2016 | $8,052 | $658,440 | $292,123 | $366,317 |
| 2015 | $7,970 | $648,551 | $287,736 | $360,815 |
| 2014 | $7,842 | $635,848 | $282,100 | $353,748 |
Source: Public Records
Map
Nearby Homes
- 5647 Southbrook Dr
- 814 Chert Place
- 5900 High St
- 415 Chupcan Place Unit 3
- 1731 Indian Wells Way
- 5665 Lewis Way
- 931 Arrowhead Terrace
- 1221 Buckeye Terrace
- 1170 Ridgemont Place
- 5555 Alabama Dr
- 1338 Shell Ln
- 1816 Eagle Peak Ave
- 1498 Delaware Dr
- 1343 Shell Ln
- 5872 Herriman Dr
- 5540 Michigan Blvd
- 1290 Easley Dr
- 1835 Camino Estrada
- 5494 Haussner Dr
- 1829 Yolanda Cir
- 5839 Verna Way E
- 50 Nottingham Cir
- 44 Nottingham Cir
- 5836 Clayton Rd
- 5834 Clayton Rd
- 5845 Verna Way E
- 5832 Verna Way E
- 5838 Clayton Rd Unit 2
- 38 Nottingham CI
- 56 Nottingham Cir
- 5838 Verna Way E
- 38 Nottingham Cir
- 31 Nottingham Cir
- 31 Nottingham CI
- 5844 Verna Way E
- 37 Nottingham Cir
- 25 Nottingham Cir
- 25 Nottingham CI
- 32 Nottingham Cir
- 43 Nottingham Cir