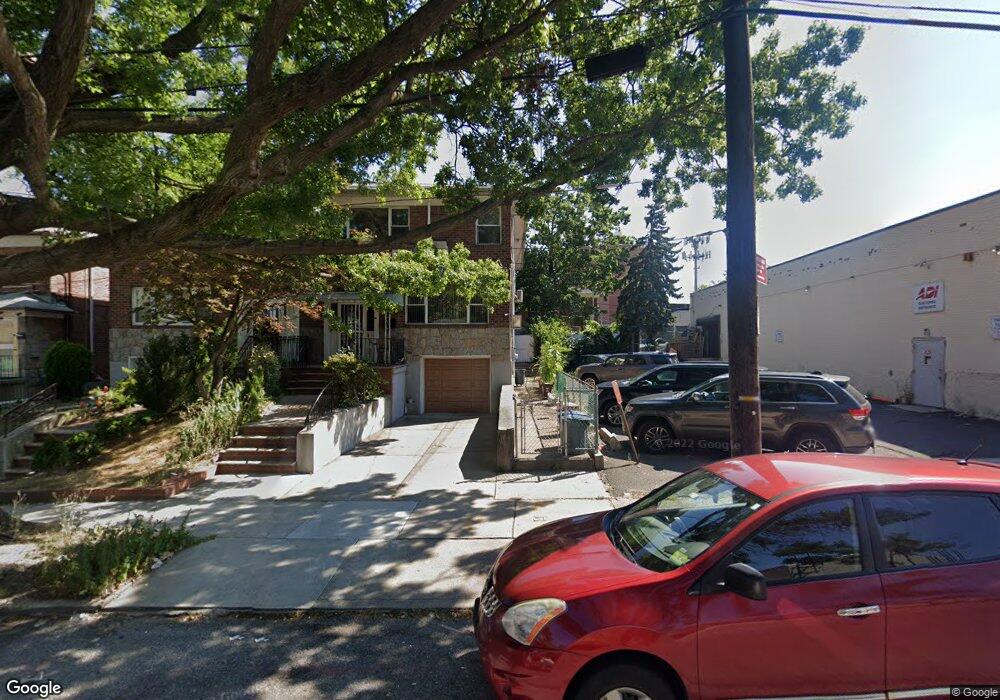
5835 182nd St Fresh Meadows, NY 11365
Auburndale NeighborhoodEstimated Value: $1,358,000 - $1,710,000
--
Bed
--
Bath
2,656
Sq Ft
$592/Sq Ft
Est. Value
About This Home
This home is located at 5835 182nd St, Fresh Meadows, NY 11365 and is currently estimated at $1,573,328, approximately $592 per square foot. 5835 182nd St is a home located in Queens County with nearby schools including P.S. 173 - Fresh Meadow, George J. Ryan Middle School 216, and Francis Lewis High School.
Ownership History
Date
Name
Owned For
Owner Type
Purchase Details
Closed on
Jul 15, 2005
Sold by
Chen Annie S and Pan Xin S
Bought by
Chen Sai Wu and Zhou Xian Hua
Current Estimated Value
Home Financials for this Owner
Home Financials are based on the most recent Mortgage that was taken out on this home.
Original Mortgage
$460,000
Interest Rate
5.67%
Mortgage Type
Purchase Money Mortgage
Purchase Details
Closed on
Mar 14, 2003
Sold by
King Bertram
Bought by
Chen Annie S and Pan Xin S
Purchase Details
Closed on
Nov 29, 1999
Sold by
King Bertram
Bought by
King Bertram and Bertram King 1999 Revocable Trust
Create a Home Valuation Report for This Property
The Home Valuation Report is an in-depth analysis detailing your home's value as well as a comparison with similar homes in the area
Home Values in the Area
Average Home Value in this Area
Purchase History
| Date | Buyer | Sale Price | Title Company |
|---|---|---|---|
| Chen Sai Wu | $722,500 | -- | |
| Chen Sai Wu | $722,500 | -- | |
| Chen Annie S | $555,000 | -- | |
| Chen Annie S | $555,000 | -- | |
| King Bertram | -- | Fidelity National Title Ins | |
| King Bertram | -- | Fidelity National Title Ins |
Source: Public Records
Mortgage History
| Date | Status | Borrower | Loan Amount |
|---|---|---|---|
| Open | Chen Sai Wu | $39,900 | |
| Closed | Chen Sai Wu | $39,900 | |
| Previous Owner | Chen Sai Wu | $460,000 | |
| Closed | Chen Annie S | $0 |
Source: Public Records
Tax History Compared to Growth
Tax History
| Year | Tax Paid | Tax Assessment Tax Assessment Total Assessment is a certain percentage of the fair market value that is determined by local assessors to be the total taxable value of land and additions on the property. | Land | Improvement |
|---|---|---|---|---|
| 2025 | $11,115 | $58,657 | $12,228 | $46,429 |
| 2024 | $11,115 | $55,339 | $13,575 | $41,764 |
| 2023 | $11,060 | $55,068 | $12,302 | $42,766 |
| 2022 | $7,779 | $94,560 | $20,400 | $74,160 |
| 2021 | $10,904 | $78,360 | $20,400 | $57,960 |
| 2020 | $10,347 | $86,100 | $20,400 | $65,700 |
| 2019 | $9,647 | $78,900 | $20,400 | $58,500 |
| 2018 | $9,355 | $45,890 | $13,698 | $32,192 |
| 2017 | $8,826 | $43,296 | $14,404 | $28,892 |
| 2016 | $8,631 | $43,296 | $14,404 | $28,892 |
| 2015 | $4,707 | $40,734 | $17,185 | $23,549 |
| 2014 | $4,707 | $38,430 | $18,744 | $19,686 |
Source: Public Records
Map
Nearby Homes
- 182-15 58th Ave Unit A
- 56-39 175th Place Unit B
- 61-31 182nd St
- 5052 Utopia Pkwy
- 56-35 174th St
- 5635 174th St
- 183-11 64th Ave
- 64-04 Utopia Pkwy
- 50-12 Utopia Pkwy
- 17211 Horace Harding Expy
- 65-15 183rd St
- 49-75 175th Place
- 17508 65th Ave
- 61-40 173rd St
- 4953 Fresh Meadow Ln
- 6740 182nd St
- 6737 180th St
- 67-07 Fresh Meadow Ln
- 58-23 192nd St
- 58-33 192nd St
- 5835 182nd St Unit 1 Fl
- 5835 182nd St Unit 1st Fl
- 5833 182nd St
- 5833 182nd St Unit 2nd Fl
- 5829 182nd St
- 5829 182nd St
- 5829 182nd St Unit 1fl
- 5829 182nd St Unit 1fl
- 18209 Horace Harding Expy
- 5827 182nd St
- 18203 Horace Harding Expy
- 5826 183rd St
- 5828 183rd St
- 5822 183rd St
- 58 183 Rd St Unit 1
- 5826 183rd St Unit 1Fl
- 5826 183rd St Unit 2Fl
- 5820 183rd St
- 5823 182nd St
- 58-20 183rd St