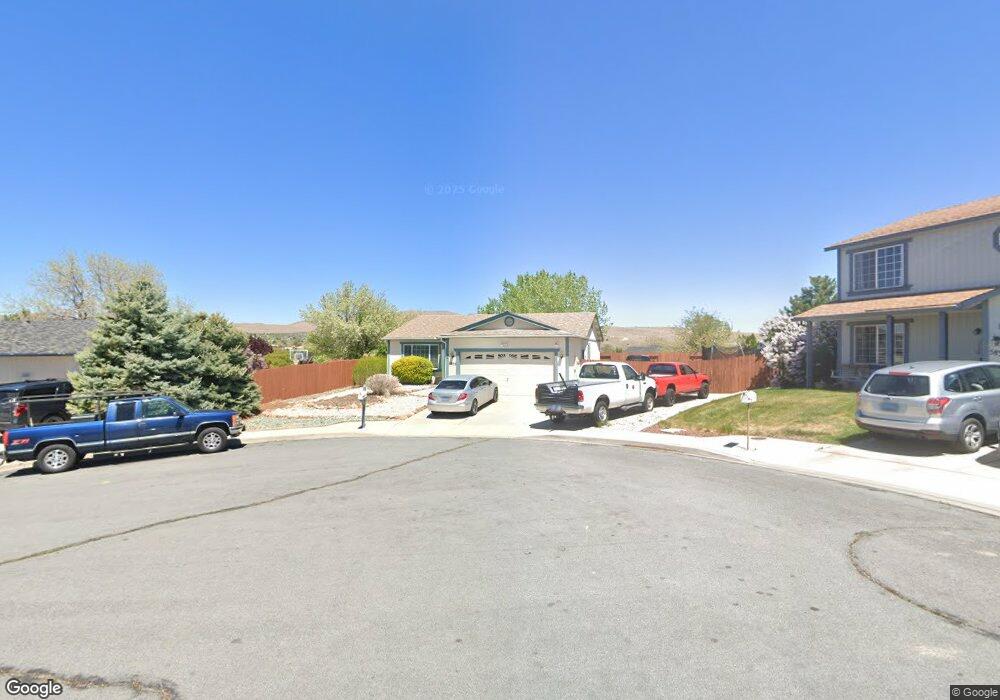
5835 Nebula Ct Sun Valley, NV 89433
Estimated Value: $409,794 - $447,000
3
Beds
2
Baths
1,185
Sq Ft
$359/Sq Ft
Est. Value
About This Home
This home is located at 5835 Nebula Ct, Sun Valley, NV 89433 and is currently estimated at $424,949, approximately $358 per square foot. 5835 Nebula Ct is a home located in Washoe County with nearby schools including Virginia Palmer Elementary School, Desert Skies Middle School, and Procter R. Hug High School.
Ownership History
Date
Name
Owned For
Owner Type
Purchase Details
Closed on
Aug 8, 2003
Sold by
Ybarra Laura E
Bought by
Matous Thomas
Current Estimated Value
Home Financials for this Owner
Home Financials are based on the most recent Mortgage that was taken out on this home.
Original Mortgage
$124,800
Outstanding Balance
$54,877
Interest Rate
5.6%
Mortgage Type
Unknown
Estimated Equity
$370,072
Purchase Details
Closed on
May 23, 2000
Sold by
Wittig Scott F and Wittig Rona M
Bought by
Ybarra Laura E
Home Financials for this Owner
Home Financials are based on the most recent Mortgage that was taken out on this home.
Original Mortgage
$122,455
Interest Rate
8.63%
Purchase Details
Closed on
Jun 17, 1997
Sold by
Lifestyle Homes Inc
Bought by
Wittig Scott F and Wittig Rona M
Home Financials for this Owner
Home Financials are based on the most recent Mortgage that was taken out on this home.
Original Mortgage
$109,577
Interest Rate
7.94%
Mortgage Type
FHA
Create a Home Valuation Report for This Property
The Home Valuation Report is an in-depth analysis detailing your home's value as well as a comparison with similar homes in the area
Home Values in the Area
Average Home Value in this Area
Purchase History
| Date | Buyer | Sale Price | Title Company |
|---|---|---|---|
| Matous Thomas | $161,500 | Stewart Title Of Northern Nv | |
| Ybarra Laura E | $129,000 | Western Title Inc | |
| Wittig Scott F | $111,500 | First American Title Co |
Source: Public Records
Mortgage History
| Date | Status | Borrower | Loan Amount |
|---|---|---|---|
| Open | Matous Thomas | $124,800 | |
| Previous Owner | Ybarra Laura E | $122,455 | |
| Previous Owner | Wittig Scott F | $109,577 | |
| Closed | Matous Thomas | $31,200 |
Source: Public Records
Tax History Compared to Growth
Tax History
| Year | Tax Paid | Tax Assessment Tax Assessment Total Assessment is a certain percentage of the fair market value that is determined by local assessors to be the total taxable value of land and additions on the property. | Land | Improvement |
|---|---|---|---|---|
| 2025 | $2,116 | $78,365 | $33,565 | $44,800 |
| 2024 | $2,116 | $75,729 | $30,345 | $45,384 |
| 2023 | $1,462 | $70,964 | $28,070 | $42,894 |
| 2022 | $1,813 | $59,713 | $23,940 | $35,773 |
| 2021 | $1,679 | $55,157 | $19,425 | $35,732 |
| 2020 | $1,578 | $53,980 | $18,130 | $35,850 |
| 2019 | $1,503 | $52,653 | $17,955 | $34,698 |
| 2018 | $1,436 | $47,197 | $13,160 | $34,037 |
| 2017 | $1,376 | $46,218 | $11,935 | $34,283 |
| 2016 | $1,341 | $45,648 | $10,745 | $34,903 |
| 2015 | $1,269 | $41,924 | $8,995 | $32,929 |
| 2014 | $1,231 | $38,054 | $7,945 | $30,109 |
| 2013 | -- | $36,977 | $5,425 | $31,552 |
Source: Public Records
Map
Nearby Homes
- 5776 Sculptor Ct
- 5688 Peach Ct
- 5886 Wishbone Ct
- 5658 Cranberry Ct
- 5963 Gardenia Ct
- 5730 Charjene Way
- 5610 Charjene Way
- 5742 Yukon Dr
- 5795 Yukon Dr
- 6458 Hatteras Ct
- 26 Lone Cedar Ct
- Plan 1 at Mesa View
- Plan 4 at Mesa View
- Plan 3 at Mesa View
- Plan 2 at Mesa View
- 610 Sun Mesa Dr
- 775 Sun Mesa Dr
- 6270 W Chinook Ct
- 285 Stone Corral Dr
- 5528 Lupin Dr
- 5833 Nebula Ct
- 5837 Nebula Ct
- 756 Snowdrop Ct
- 754 Snowdrop Ct
- 758 Snowdrop Ct
- 5842 Nebula Ct
- 5831 Nebula Ct
- 5838 Nebula Ct
- 752 Snowdrop Ct
- 760 Snowdrop Ct
- 5836 Nebula Ct
- 750 Snowdrop Ct
- 5840 Nebula Ct
- 5834 Nebula Ct
- 757 Snowdrop Ct
- 755 Snowdrop Ct
- 762 Snowdrop Ct
- 753 Snowdrop Ct Unit Snowdrop Ct
- 759 Snowdrop Ct
- 748 Snowdrop Ct