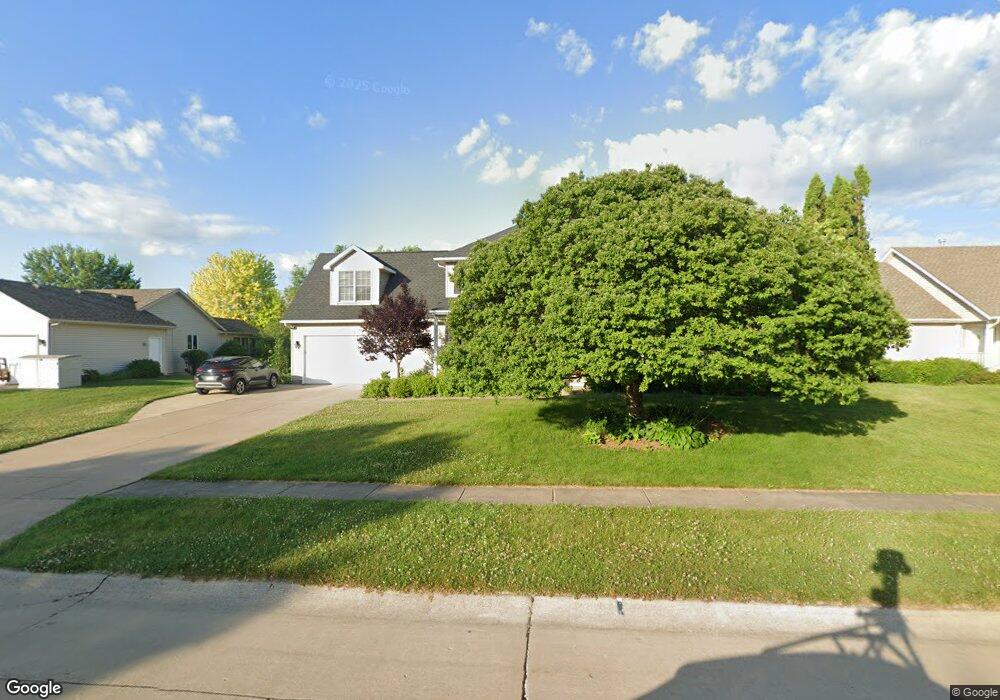
5836 Stephen Cir Davenport, IA 52807
Estimated Value: $452,000 - $499,000
4
Beds
4
Baths
2,610
Sq Ft
$180/Sq Ft
Est. Value
About This Home
This home is located at 5836 Stephen Cir, Davenport, IA 52807 and is currently estimated at $470,618, approximately $180 per square foot. 5836 Stephen Cir is a home located in Scott County with nearby schools including Grant Wood Elementary School, Bettendorf Middle School, and Bettendorf High School.
Ownership History
Date
Name
Owned For
Owner Type
Purchase Details
Closed on
Mar 26, 2010
Sold by
Berg Richard D and Berg Sonia R
Bought by
Raso Michael and Raso Dyan
Current Estimated Value
Home Financials for this Owner
Home Financials are based on the most recent Mortgage that was taken out on this home.
Original Mortgage
$275,793
Outstanding Balance
$183,323
Interest Rate
4.96%
Mortgage Type
FHA
Estimated Equity
$287,295
Purchase Details
Closed on
Aug 22, 2008
Sold by
Kimberly K Berg Revocable Trust
Bought by
Berg Kimberly K and Berg Richard D
Home Financials for this Owner
Home Financials are based on the most recent Mortgage that was taken out on this home.
Original Mortgage
$297,000
Interest Rate
6.66%
Mortgage Type
Stand Alone Refi Refinance Of Original Loan
Purchase Details
Closed on
Apr 15, 2006
Sold by
Berg Richard D and Berg Kimberly K
Bought by
Berg Kimberly K and Berg Richard D
Create a Home Valuation Report for This Property
The Home Valuation Report is an in-depth analysis detailing your home's value as well as a comparison with similar homes in the area
Home Values in the Area
Average Home Value in this Area
Purchase History
| Date | Buyer | Sale Price | Title Company |
|---|---|---|---|
| Raso Michael | $281,000 | Security First Title Co | |
| Berg Kimberly K | -- | None Available | |
| Berg Kimberly K | -- | None Available |
Source: Public Records
Mortgage History
| Date | Status | Borrower | Loan Amount |
|---|---|---|---|
| Open | Raso Michael | $275,793 | |
| Previous Owner | Berg Kimberly K | $297,000 |
Source: Public Records
Tax History Compared to Growth
Tax History
| Year | Tax Paid | Tax Assessment Tax Assessment Total Assessment is a certain percentage of the fair market value that is determined by local assessors to be the total taxable value of land and additions on the property. | Land | Improvement |
|---|---|---|---|---|
| 2024 | $7,066 | $410,070 | $68,030 | $342,040 |
| 2023 | $7,095 | $410,070 | $68,030 | $342,040 |
| 2022 | $6,758 | $351,670 | $48,590 | $303,080 |
| 2021 | $6,758 | $351,670 | $48,590 | $303,080 |
| 2020 | $6,924 | $348,360 | $48,590 | $299,770 |
| 2019 | $7,413 | $348,360 | $48,590 | $299,770 |
| 2018 | $1,027 | $348,360 | $48,590 | $299,770 |
| 2017 | $1,853 | $333,060 | $48,590 | $284,470 |
| 2016 | $6,491 | $308,590 | $0 | $0 |
| 2015 | $6,312 | $300,030 | $0 | $0 |
| 2014 | $6,200 | $300,030 | $0 | $0 |
| 2013 | $6,066 | $0 | $0 | $0 |
| 2012 | -- | $281,370 | $47,670 | $233,700 |
Source: Public Records
Map
Nearby Homes
- 1918 E 59th Ct
- 1912 E 59th Ct
- 1906 E 59th Ct
- 1908 Katie Ct
- 1708 E 59th Ct
- 1816 E 59th Ct
- 1810 E 59th Ct
- 1804 E 59th Ct
- 1714 E 59th Ct
- 1705 E 59th Ct
- 1711 E 59th Ct
- 1717 E 59th Ct
- 1807 E 59th Ct
- 1813 E 59th Ct
- 1814 Katie Ct
- 9 E 61st Ct
- 4150 E 60th St Unit 1004
- 4006 Kathleen Way
- 6401 Utica Ridge Rd Unit 4
- 4554 Bunker Hill Dr
- 5824 Stephen Cir
- 5848 Stephen Cir
- 5812 Stephen Cir
- 5860 Stephen Cir
- 5837 Stephen Cir
- 5825 Stephen Cir
- 5868 Stephen Cir
- 5849 Stephen Cir
- 5802 Stephen Cir
- 5861 Stephen Cir
- 5813 Stephen Cir
- 5801 Stephen Cir
- 5872 Stephen Cir
- 5873 Stephen Cir
- 3633 E 59th Ct
- 5885 Stephen Cir
- 3625 E 59th Ct
- 5909 Stephen Cir
- 3715 E 59th St
- 3617 E 59th Ct