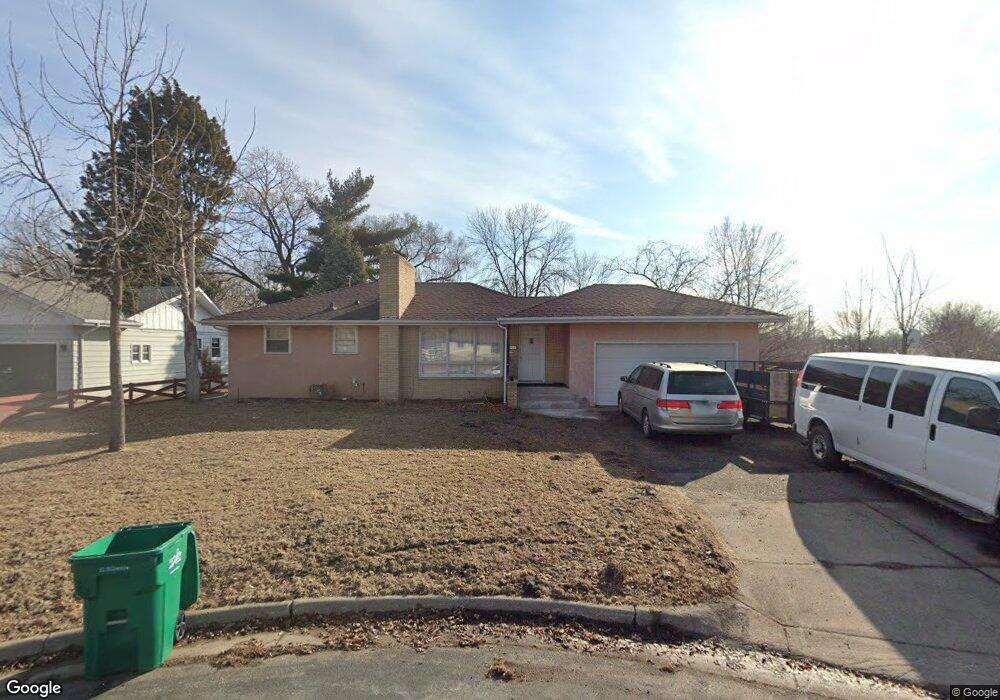
5836 Upton Ave N Minneapolis, MN 55430
Garden City NeighborhoodEstimated Value: $308,000 - $325,000
3
Beds
2
Baths
1,924
Sq Ft
$165/Sq Ft
Est. Value
About This Home
This home is located at 5836 Upton Ave N, Minneapolis, MN 55430 and is currently estimated at $318,206, approximately $165 per square foot. 5836 Upton Ave N is a home located in Hennepin County with nearby schools including Northport Elementary School, Robbinsdale Middle School, and Robbinsdale Cooper Senior High School.
Ownership History
Date
Name
Owned For
Owner Type
Purchase Details
Closed on
Jun 3, 2022
Sold by
Lee Tou
Bought by
Lee Gao
Current Estimated Value
Home Financials for this Owner
Home Financials are based on the most recent Mortgage that was taken out on this home.
Original Mortgage
$279,000
Outstanding Balance
$265,097
Interest Rate
5.11%
Mortgage Type
New Conventional
Estimated Equity
$53,109
Purchase Details
Closed on
Jun 1, 2022
Sold by
Tou Lee
Bought by
Lee Gao Houa Choua
Home Financials for this Owner
Home Financials are based on the most recent Mortgage that was taken out on this home.
Original Mortgage
$279,000
Outstanding Balance
$265,097
Interest Rate
5.11%
Mortgage Type
New Conventional
Estimated Equity
$53,109
Purchase Details
Closed on
Nov 28, 2012
Sold by
Lee Kong Meng and Vue Kong
Bought by
Lee Tou
Purchase Details
Closed on
Apr 23, 2004
Sold by
Yiu Yung Chin and Ng Sutman
Bought by
Lee Tou and Lee Kong Meng
Purchase Details
Closed on
Jun 15, 2001
Sold by
Fedler Marcus J and Fedler Heather M
Bought by
Yiu Yung Chin
Purchase Details
Closed on
Apr 28, 2000
Sold by
Harris Dean Lawrence and Harris Joann Marie
Bought by
Fedler Marcus J and Fedler Heather M
Create a Home Valuation Report for This Property
The Home Valuation Report is an in-depth analysis detailing your home's value as well as a comparison with similar homes in the area
Home Values in the Area
Average Home Value in this Area
Purchase History
| Date | Buyer | Sale Price | Title Company |
|---|---|---|---|
| Lee Gao | $310,000 | -- | |
| Lee Gao Houa Choua | $310,000 | None Listed On Document | |
| Lee Tou | -- | None Available | |
| Lee Tou | $194,000 | -- | |
| Yiu Yung Chin | $164,900 | -- | |
| Fedler Marcus J | $144,000 | -- |
Source: Public Records
Mortgage History
| Date | Status | Borrower | Loan Amount |
|---|---|---|---|
| Open | Lee Gao | $279,000 | |
| Closed | Lee Gao Houa Choua | $279,000 |
Source: Public Records
Tax History Compared to Growth
Tax History
| Year | Tax Paid | Tax Assessment Tax Assessment Total Assessment is a certain percentage of the fair market value that is determined by local assessors to be the total taxable value of land and additions on the property. | Land | Improvement |
|---|---|---|---|---|
| 2024 | $4,008 | $279,600 | $87,200 | $192,400 |
| 2023 | $3,977 | $282,000 | $90,300 | $191,700 |
| 2022 | $3,298 | $268,000 | $83,000 | $185,000 |
| 2021 | $3,251 | $231,000 | $70,000 | $161,000 |
| 2020 | $3,401 | $215,000 | $60,000 | $155,000 |
| 2019 | $3,311 | $218,000 | $68,000 | $150,000 |
| 2018 | $2,862 | $201,000 | $57,000 | $144,000 |
| 2017 | $2,614 | $163,000 | $48,000 | $115,000 |
| 2016 | $2,996 | $175,500 | $46,200 | $129,300 |
| 2015 | $2,675 | $160,600 | $43,500 | $117,100 |
| 2014 | -- | $137,200 | $41,800 | $95,400 |
Source: Public Records
Map
Nearby Homes
- 5913 Zenith Ave N
- 6019 Zenith Ave N
- 2017 Brookview Dr
- 2813 Ohenry Rd
- 5819 Knox Ave N
- 2212 55th Ave N
- 5533 Morgan Ave N
- 2812 64th Ave N
- 5842 James Ave N
- 5932 Admiral Ln N
- 5808 Pearson Dr
- 3113 65th Ave N
- 5809 Pearson Dr
- 5244 Vincent Ave N
- 5253 Queen Ave N
- 5252 Queen Ave N
- 5307 Newton Ave N
- 6000 Girard Ave N
- 5337 Sailor Ln
- 5524 Humboldt Ave N
- 5842 Upton Ave N
- 5900 Upton Ave N
- 5837 Upton Ave N
- 5843 Upton Ave N
- 5906 Upton Ave N
- 2850 Northway Dr
- 2850 Northway Dr
- 5901 Upton Ave N
- 5912 Upton Ave N
- 5907 Upton Ave N
- 5836 Vincent Ave N
- 5842 Vincent Ave N
- 5900 Vincent Ave N
- 5913 Upton Ave N
- 5918 Upton Ave N
- 5906 Vincent Ave N
- 5919 Upton Ave N
- 5924 Upton Ave N
- 5837 Vincent Ave N
- 5843 Vincent Ave N