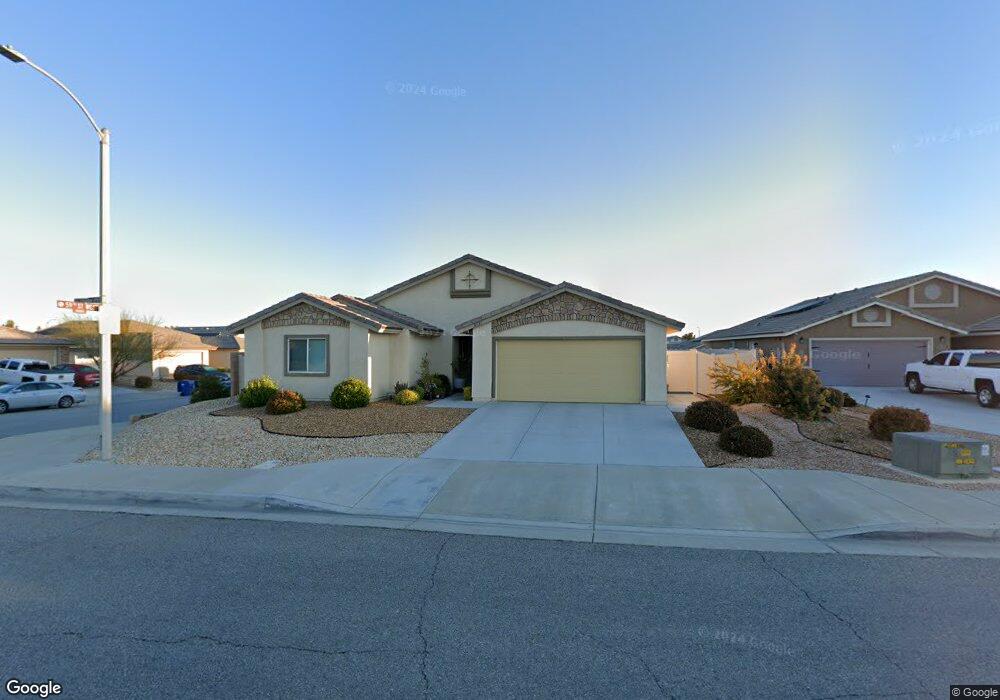
5837 Forry Ct Lancaster, CA 93536
West Lancaster NeighborhoodEstimated Value: $553,000 - $611,000
4
Beds
3
Baths
2,630
Sq Ft
$223/Sq Ft
Est. Value
About This Home
This home is located at 5837 Forry Ct, Lancaster, CA 93536 and is currently estimated at $586,268, approximately $222 per square foot. 5837 Forry Ct is a home located in Los Angeles County with nearby schools including Sundown Elementary School, Lancaster High School, and Fabunni Private School Inc..
Ownership History
Date
Name
Owned For
Owner Type
Purchase Details
Closed on
Aug 4, 2018
Sold by
Harris Homes Inc
Bought by
Kaseforth Daniel and Kaseforth Nari
Current Estimated Value
Home Financials for this Owner
Home Financials are based on the most recent Mortgage that was taken out on this home.
Original Mortgage
$336,000
Outstanding Balance
$291,802
Interest Rate
4.5%
Mortgage Type
New Conventional
Estimated Equity
$294,466
Purchase Details
Closed on
Dec 7, 2007
Sold by
Lancaster Pavilion Lp
Bought by
Harris Homes Inc
Create a Home Valuation Report for This Property
The Home Valuation Report is an in-depth analysis detailing your home's value as well as a comparison with similar homes in the area
Home Values in the Area
Average Home Value in this Area
Purchase History
| Date | Buyer | Sale Price | Title Company |
|---|---|---|---|
| Kaseforth Daniel | $420,000 | First American Title Company | |
| Harris Homes Inc | $5,256,000 | Old Republic Title Company |
Source: Public Records
Mortgage History
| Date | Status | Borrower | Loan Amount |
|---|---|---|---|
| Open | Kaseforth Daniel | $336,000 |
Source: Public Records
Tax History
| Year | Tax Paid | Tax Assessment Tax Assessment Total Assessment is a certain percentage of the fair market value that is determined by local assessors to be the total taxable value of land and additions on the property. | Land | Improvement |
|---|---|---|---|---|
| 2025 | $7,037 | $468,512 | $117,127 | $351,385 |
| 2024 | $7,037 | $459,327 | $114,831 | $344,496 |
| 2023 | $6,966 | $450,322 | $112,580 | $337,742 |
| 2022 | $6,717 | $441,493 | $110,373 | $331,120 |
| 2021 | $6,268 | $432,837 | $108,209 | $324,628 |
| 2020 | $6,198 | $428,400 | $107,100 | $321,300 |
| 2019 | $5,967 | $420,000 | $105,000 | $315,000 |
| 2018 | $3,914 | $242,848 | $79,188 | $163,660 |
| 2017 | $1,352 | $77,636 | $77,636 | $0 |
| 2016 | $1,636 | $76,114 | $76,114 | $0 |
| 2015 | $1,295 | $74,971 | $74,971 | $0 |
| 2014 | $1,283 | $73,503 | $73,503 | $0 |
Source: Public Records
Map
Nearby Homes
- 43869 Hampton St
- 0 61st St W
- 60 W Avenue J-4
- 43838 Madison Ct
- 43645 59th St W
- 6223 W Avenue j12
- 43637 59th St W
- 5818 W Avenue j15
- 6304 Starview Dr
- 6147 W Avenue j15
- 0 St W Unit 26000550
- 6157 W Avenue j4
- 60 Stw Vic Ave
- 5659 W Avenue j15
- 5645 W Avenue j15
- 43815 Encanto Way
- 0 56th West & J3
- 44241 Tahoe Way
- 44335 57th St W
- 44220 Encanto Way
Your Personal Tour Guide
Ask me questions while you tour the home.