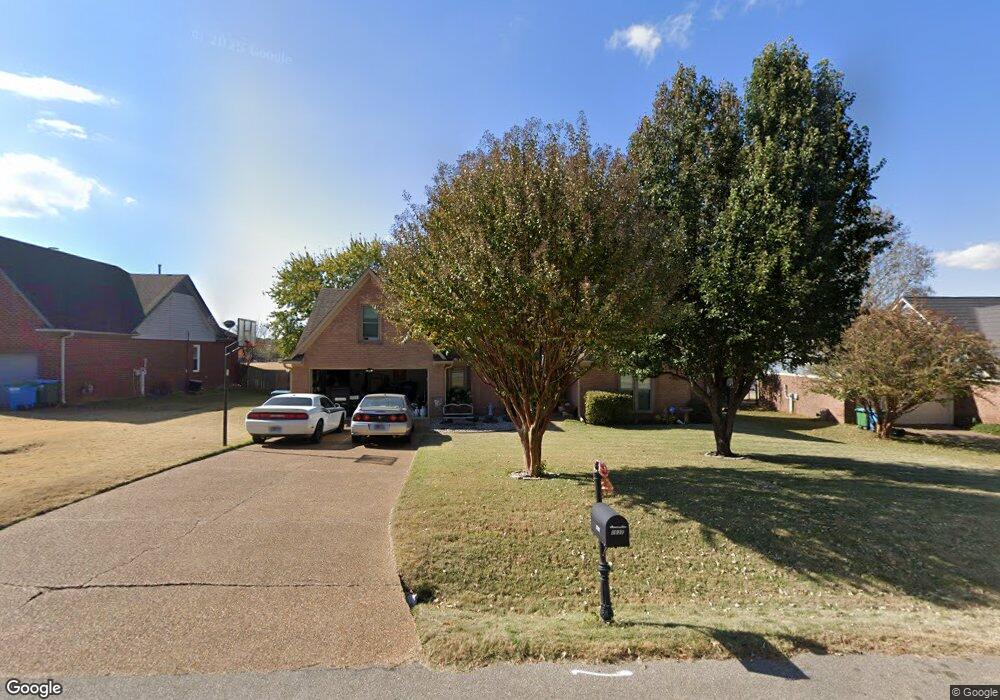
5837 Thunderbird Rd Arlington, TN 38002
Estimated Value: $298,411 - $392,000
4
Beds
2
Baths
2,108
Sq Ft
$162/Sq Ft
Est. Value
About This Home
This home is located at 5837 Thunderbird Rd, Arlington, TN 38002 and is currently estimated at $342,353, approximately $162 per square foot. 5837 Thunderbird Rd is a home located in Shelby County with nearby schools including Arlington Elementary School, Arlington Middle School, and Arlington High School.
Ownership History
Date
Name
Owned For
Owner Type
Purchase Details
Closed on
Aug 4, 2008
Sold by
Wiseman Susan H
Bought by
Gilliland John D and Gilliland Erica E
Current Estimated Value
Home Financials for this Owner
Home Financials are based on the most recent Mortgage that was taken out on this home.
Original Mortgage
$182,683
Outstanding Balance
$118,775
Interest Rate
6.31%
Mortgage Type
Unknown
Estimated Equity
$223,578
Purchase Details
Closed on
Dec 26, 2007
Sold by
Wiseman Thomas Lang
Bought by
Wiseman Susan Howard
Purchase Details
Closed on
Feb 26, 1997
Sold by
Snyder Home Builders Llc
Bought by
Wiseman Thomas Lang and Wiseman Susan H
Home Financials for this Owner
Home Financials are based on the most recent Mortgage that was taken out on this home.
Original Mortgage
$124,766
Interest Rate
7.91%
Mortgage Type
FHA
Create a Home Valuation Report for This Property
The Home Valuation Report is an in-depth analysis detailing your home's value as well as a comparison with similar homes in the area
Home Values in the Area
Average Home Value in this Area
Purchase History
| Date | Buyer | Sale Price | Title Company |
|---|---|---|---|
| Gilliland John D | $177,000 | Chicago Title Insurance Co | |
| Wiseman Susan Howard | -- | None Available | |
| Wiseman Thomas Lang | $124,900 | -- | |
| Wiseman Thomas Lang | $124,900 | -- |
Source: Public Records
Mortgage History
| Date | Status | Borrower | Loan Amount |
|---|---|---|---|
| Open | Gilliland John D | $182,683 | |
| Previous Owner | Wiseman Thomas Lang | $124,766 |
Source: Public Records
Tax History
| Year | Tax Paid | Tax Assessment Tax Assessment Total Assessment is a certain percentage of the fair market value that is determined by local assessors to be the total taxable value of land and additions on the property. | Land | Improvement |
|---|---|---|---|---|
| 2025 | $1,688 | $66,375 | $14,550 | $51,825 |
| 2024 | $3,376 | $49,800 | $13,050 | $36,750 |
| 2023 | $2,326 | $49,800 | $13,050 | $36,750 |
| 2022 | $2,326 | $49,800 | $13,050 | $36,750 |
| 2021 | $2,356 | $49,800 | $13,050 | $36,750 |
| 2020 | $2,423 | $44,700 | $11,000 | $33,700 |
| 2019 | $1,810 | $44,700 | $11,000 | $33,700 |
| 2018 | $2,324 | $44,700 | $11,000 | $33,700 |
| 2017 | $2,351 | $44,700 | $11,000 | $33,700 |
| 2016 | $2,005 | $36,325 | $0 | $0 |
| 2014 | $1,587 | $36,325 | $0 | $0 |
Source: Public Records
Map
Nearby Homes
- 11896 Berry Patch Cove
- 11916 Berry Patch Cove
- 11771 Mcauley St
- 11905 Country Valley Cove
- 5995 Henning Oaks Cove
- 11979 Henning Oaks Ln
- 5991 Marley St
- 12016 Cranston Dr
- 6038 Armistead St
- 5571 Hayes Crest Cir W
- 5565 Hayes Crest Cir W
- 11799 Village Center St
- 0 Commander Dr
- 12152 Preserve Ln
- 5127 Lawrenceburg Ln E
- 12275 Snyderwood Dr
- 11819 Highway 70
- 5970 Ticer Dr
- 12150 Osborne Grove Dr
- 12080 Goldspring Ln
- 5829 Thunderbird Rd
- 5853 Thunderbird Rd
- 5842 Thunderbird Rd
- 5830 Thunderbird Rd
- 5819 Thunderbird Rd
- 5860 Thunderbird Rd
- 5796 Bridal Cove
- 11895 Brockwell St
- 11895 Brockwell Rd
- 11903 Brockwell St
- 11903 Brockwell Rd
- 5861 Thunderbird Rd
- 11911 Brockwell St
- 5790 Bridal Cove
- 5849 Polk St
- 5795 Bridal Cove
- 5879 Thunderbird Rd
- 11919 Brockwell St
- 11890 Bridal Ln
- 11919 Brockwell Rd
Your Personal Tour Guide
Ask me questions while you tour the home.