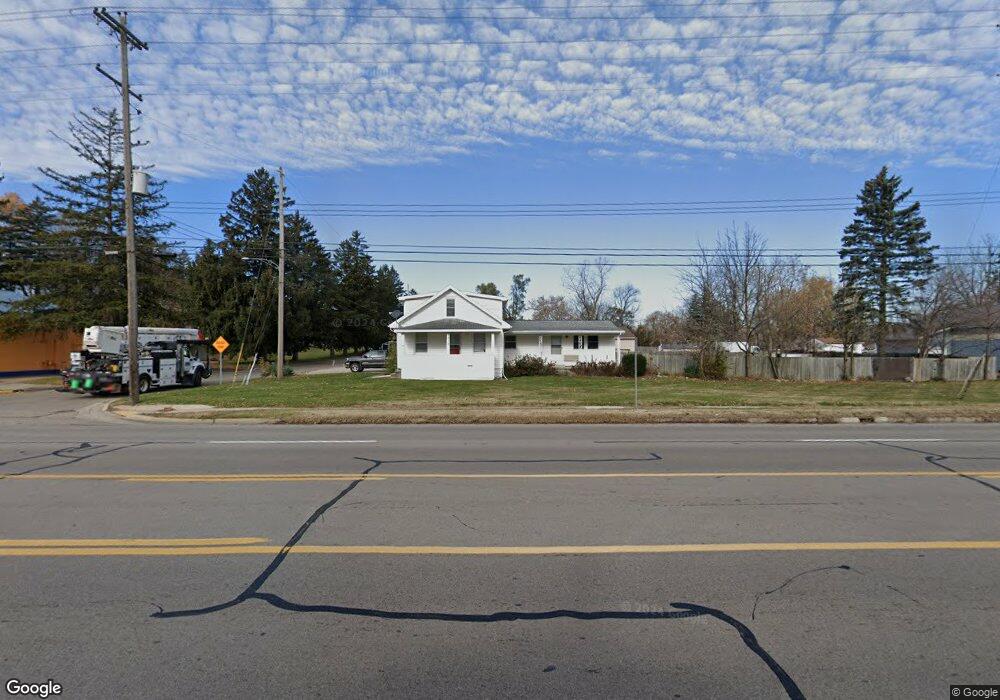
5838 S Mlk Blvd Lansing, MI 48911
Southern Lansing NeighborhoodEstimated Value: $150,240 - $180,000
Studio
--
Bath
1,245
Sq Ft
$130/Sq Ft
Est. Value
About This Home
This home is located at 5838 S Mlk Blvd, Lansing, MI 48911 and is currently estimated at $162,060, approximately $130 per square foot. 5838 S Mlk Blvd is a home located in Ingham County with nearby schools including Reo Elementary School, Attwood School, and Everett High School.
Ownership History
Date
Name
Owned For
Owner Type
Purchase Details
Closed on
Sep 28, 2023
Sold by
Sheets Duke Matthew and Sheets Amanda Mae
Bought by
Jackpot Towing Llc
Current Estimated Value
Purchase Details
Closed on
Sep 17, 2020
Sold by
Sheets Duke
Bought by
Sheets Duke Matthew and Sheets Amanda Mae
Purchase Details
Closed on
Sep 16, 2020
Sold by
Sheets Duke
Bought by
Sheets Duke Matthew and Sheets Amanda Mae
Purchase Details
Closed on
Sep 14, 2020
Sold by
Dw Sheets Iv Llc
Bought by
Sheets David
Purchase Details
Closed on
Jun 20, 2018
Sold by
Sheets David
Bought by
Sheets Duke
Purchase Details
Closed on
Sep 25, 2015
Sold by
Sheets David W
Bought by
D W Sheets I Llc
Purchase Details
Closed on
Dec 30, 2011
Sold by
Sheets David W
Bought by
D W Sheets Iv Llc
Purchase Details
Closed on
Jul 2, 2009
Sold by
Reust Chad
Bought by
Us Bank National Association
Purchase Details
Closed on
Aug 11, 2006
Sold by
Stockenauer Steven and Stockenauer Vicki L
Bought by
Reust Chad
Home Financials for this Owner
Home Financials are based on the most recent Mortgage that was taken out on this home.
Original Mortgage
$117,000
Interest Rate
6.78%
Mortgage Type
Purchase Money Mortgage
Purchase Details
Closed on
Mar 22, 2006
Sold by
Equicredit
Bought by
The Bank Of New York
Purchase Details
Closed on
Feb 16, 2006
Sold by
Stockenauer Steven and Stockenauer Vicki L
Bought by
Equicredit
Purchase Details
Closed on
Oct 16, 2000
Sold by
Holoway Robert Peter and Holoway Lynn Marie
Bought by
Stockenauer Steven and Stockenauer Vicki L
Home Financials for this Owner
Home Financials are based on the most recent Mortgage that was taken out on this home.
Original Mortgage
$84,600
Interest Rate
10.5%
Mortgage Type
Stand Alone First
Purchase Details
Closed on
Aug 2, 1998
Sold by
Holoway Robert P and Holoway Lynne M
Bought by
Stockenauer Steven and Stockenauer Vicki L
Purchase Details
Closed on
Oct 3, 1996
Bought by
Holoway Robert and Holoway Lynne
Create a Home Valuation Report for This Property
The Home Valuation Report is an in-depth analysis detailing your home's value as well as a comparison with similar homes in the area
Home Values in the Area
Average Home Value in this Area
Purchase History
| Date | Buyer | Sale Price | Title Company |
|---|---|---|---|
| Jackpot Towing Llc | $145,000 | None Listed On Document | |
| Sheets Duke Matthew | -- | None Listed On Document | |
| Sheets Duke Matthew | -- | None Available | |
| Sheets David | -- | None Listed On Document | |
| Sheets David | -- | None Listed On Document | |
| Sheets Duke | -- | None Listed On Document | |
| Sheets Duke | -- | None Available | |
| D W Sheets I Llc | -- | None Available | |
| D W Sheets Iv Llc | -- | None Available | |
| Us Bank National Association | $37,125 | None Available | |
| Reust Chad | $130,000 | Fatic | |
| The Bank Of New York | -- | None Available | |
| Equicredit | $104,752 | None Available | |
| Stockenauer Steven | $85,000 | -- | |
| Stockenauer Steven | $85,000 | -- | |
| Holoway Robert | $52,000 | -- |
Source: Public Records
Mortgage History
| Date | Status | Borrower | Loan Amount |
|---|---|---|---|
| Previous Owner | Reust Chad | $117,000 | |
| Previous Owner | Stockenauer Steven | $84,600 | |
| Closed | Sheets Duke | $0 |
Source: Public Records
Tax History
| Year | Tax Paid | Tax Assessment Tax Assessment Total Assessment is a certain percentage of the fair market value that is determined by local assessors to be the total taxable value of land and additions on the property. | Land | Improvement |
|---|---|---|---|---|
| 2025 | $3,545 | $85,800 | $19,800 | $66,000 |
| 2024 | $30 | $42,300 | $19,800 | $22,500 |
| 2023 | $2,455 | $38,600 | $19,800 | $18,800 |
| 2022 | $2,242 | $32,200 | $12,700 | $19,500 |
| 2021 | $2,190 | $28,200 | $12,300 | $15,900 |
| 2020 | $1,704 | $27,400 | $12,300 | $15,100 |
| 2019 | $1,618 | $26,100 | $12,300 | $13,800 |
| 2018 | $1,888 | $24,000 | $12,300 | $11,700 |
| 2017 | $1,817 | $24,000 | $12,300 | $11,700 |
| 2016 | $2,166 | $23,800 | $12,300 | $11,500 |
| 2015 | $2,166 | $23,300 | $0 | $0 |
| 2014 | $2,166 | $28,800 | $0 | $0 |
Source: Public Records
Map
Nearby Homes
- 5838 S Martin Luther King Junior Blvd
- 5650 Hughes Rd
- 5902 Haag Rd
- 6037 Hughes Rd
- 1406 Weymouth Ct
- 1309 Penrod Ct
- 5641 Ashley Dr
- 2411 Bliesener St
- 1020 R G Curtiss Ave
- 0 Midwood St
- 1006 Attwood Dr
- 5017 Christiansen Rd
- 1001 Ferley St
- 2416 Midwood St
- 826 R G Curtiss Ave
- 4928 Hughes Rd
- 4927 Starr Ave
- 2918 Midwood St
- 0 W Jolly Rd
- 1215 S Briarfield Dr
- 5838 S Mlk Ave
- 5856 S Martin Luther King jr Blvd
- 5715 Valencia Blvd
- 5831 S Mlk Blvd
- 5812 S Mlk Blvd
- 5857 S Mlk Blvd
- 5703 Valencia Blvd
- 5823 S Mlk Blvd
- 5812 Valencia Blvd
- 5708 Hughes Rd Unit A
- 5708 Hughes Rd
- 5675 Valencia Blvd
- 5864 S Mlk jr Blvd
- 5819 Valencia Blvd
- 5861 S Mlk Blvd
- 5716 Hughes Rd Unit A
- 5716 Hughes Rd
- 0 Selfridge Blvd
- 5867 S Mlk Blvd
- 5644 Hughes Rd
Your Personal Tour Guide
Ask me questions while you tour the home.