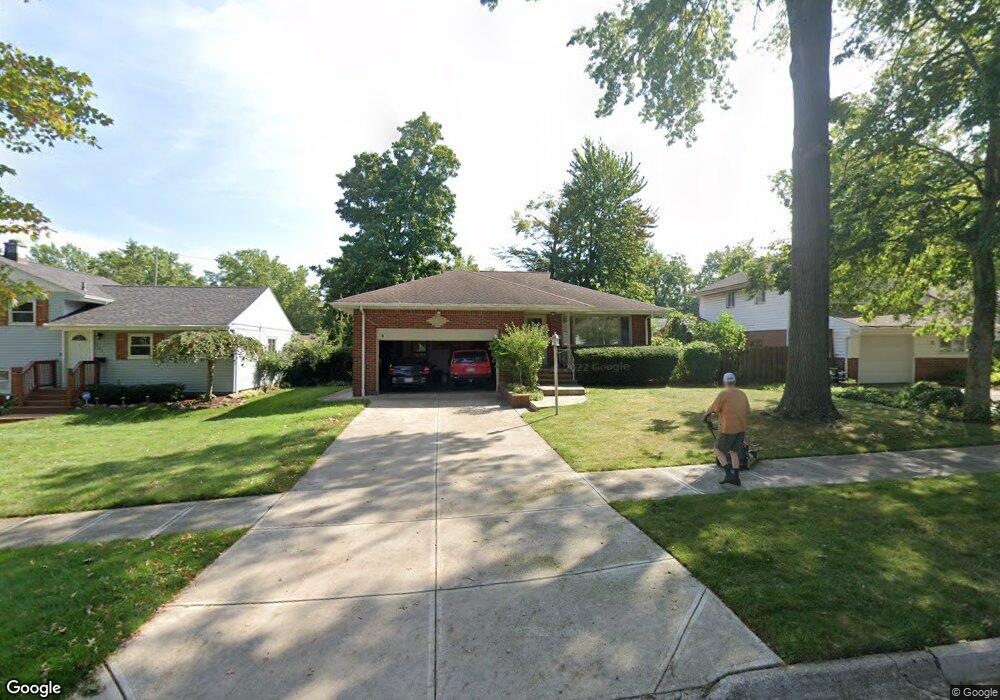
5839 Doxmere Dr Parma Heights, OH 44130
Estimated Value: $206,584 - $234,000
3
Beds
1
Bath
1,253
Sq Ft
$172/Sq Ft
Est. Value
About This Home
This home is located at 5839 Doxmere Dr, Parma Heights, OH 44130 and is currently estimated at $215,396, approximately $171 per square foot. 5839 Doxmere Dr is a home located in Cuyahoga County with nearby schools including Greenbriar Middle School, Ridge-Brook Elementary School, and Valley Forge High School.
Ownership History
Date
Name
Owned For
Owner Type
Purchase Details
Closed on
Oct 2, 2020
Sold by
Steimle Kelly J
Bought by
Steimle Thomas P
Current Estimated Value
Purchase Details
Closed on
May 30, 1996
Sold by
Sisters Of Saint Joseph
Bought by
Steimle Thomas P and Steimle Kelly J
Home Financials for this Owner
Home Financials are based on the most recent Mortgage that was taken out on this home.
Original Mortgage
$114,000
Interest Rate
7.99%
Mortgage Type
New Conventional
Purchase Details
Closed on
Jun 1, 1995
Sold by
Kuchta Karl K
Bought by
Sisters Of Saint Joseph Of St Mark
Purchase Details
Closed on
Jun 25, 1990
Sold by
Papson Emily K
Bought by
Kuchta Karl L
Purchase Details
Closed on
Nov 16, 1977
Sold by
Papson John F and Papson Emily K
Bought by
Papson Emily K
Purchase Details
Closed on
Jan 1, 1975
Bought by
Papson John F and Papson Emily K
Create a Home Valuation Report for This Property
The Home Valuation Report is an in-depth analysis detailing your home's value as well as a comparison with similar homes in the area
Home Values in the Area
Average Home Value in this Area
Purchase History
| Date | Buyer | Sale Price | Title Company |
|---|---|---|---|
| Steimle Thomas P | -- | Caputo Donna Ramsey | |
| Steimle Thomas P | $120,000 | -- | |
| Sisters Of Saint Joseph Of St Mark | $118,000 | -- | |
| Kuchta Karl L | $87,000 | -- | |
| Papson Emily K | -- | -- | |
| Papson John F | -- | -- |
Source: Public Records
Mortgage History
| Date | Status | Borrower | Loan Amount |
|---|---|---|---|
| Previous Owner | Steimle Thomas P | $114,000 |
Source: Public Records
Tax History Compared to Growth
Tax History
| Year | Tax Paid | Tax Assessment Tax Assessment Total Assessment is a certain percentage of the fair market value that is determined by local assessors to be the total taxable value of land and additions on the property. | Land | Improvement |
|---|---|---|---|---|
| 2024 | $3,807 | $58,800 | $12,355 | $46,445 |
| 2023 | $3,412 | $45,500 | $10,430 | $35,070 |
| 2022 | $3,394 | $45,500 | $10,430 | $35,070 |
| 2021 | $3,574 | $47,880 | $10,430 | $37,450 |
| 2020 | $3,224 | $38,610 | $8,400 | $30,210 |
| 2019 | $3,138 | $110,300 | $24,000 | $86,300 |
| 2018 | $3,079 | $38,610 | $8,400 | $30,210 |
| 2017 | $3,028 | $34,830 | $7,600 | $27,230 |
| 2016 | $3,007 | $34,830 | $7,600 | $27,230 |
| 2015 | $3,105 | $34,830 | $7,600 | $27,230 |
| 2014 | $3,105 | $36,260 | $7,910 | $28,350 |
Source: Public Records
Map
Nearby Homes
- 5882 Kings Hwy
- 10910 Windham Rd
- 11914 Tucson Dr
- 10172 Keswick Dr
- 0 Parkhill Dr Unit 5116837
- 10620 Aaron Dr
- 9621 Elsmere Dr
- 5845 Lotusdale Dr
- 6111 Denison Blvd
- 6359 Olde York Rd Unit 6359
- 6274 Anita Dr
- 9417 Fernhill Ave
- 5860 Pearl Rd
- 9012 W Moreland Rd
- 9118 Fernhill Ave
- 6369 Anita Dr
- 6436 Olde York Rd
- 6413 Alexandria Dr
- 5906 Twin Lakes Dr
- 13489 Havendale Dr
- 5845 Doxmere Dr
- 5831 Doxmere Dr
- 5853 Doxmere Dr
- 5825 Doxmere Dr
- 5840 Calamie Dr
- 5846 Calamie Dr
- 5832 Calamie Dr
- 5854 Calamie Dr
- 5859 Doxmere Dr
- 5826 Calamie Dr
- 5817 Doxmere Dr
- 5840 Doxmere Dr
- 5832 Doxmere Dr
- 5846 Doxmere Dr
- 5860 Calamie Dr
- 5818 Calamie Dr
- 5826 Doxmere Dr
- 5854 Doxmere Dr
- 5855 Doxmere Dr
- 5818 Doxmere Dr