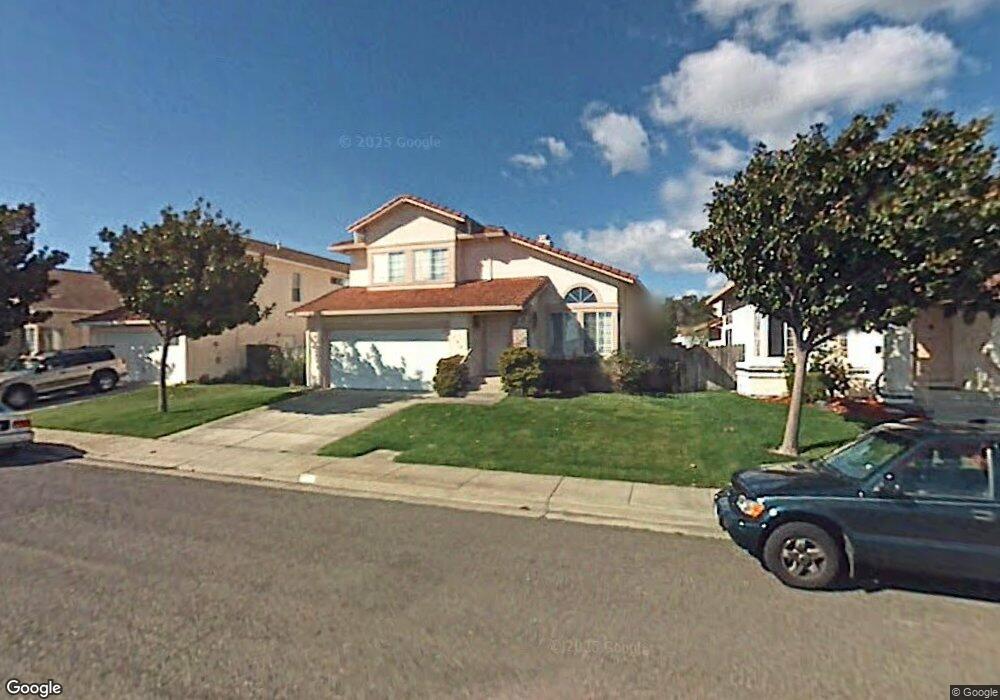
584 Catalina Cir Unit 9 Vallejo, CA 94589
North Vallejo NeighborhoodEstimated Value: $604,228 - $664,000
4
Beds
3
Baths
1,986
Sq Ft
$318/Sq Ft
Est. Value
About This Home
This home is located at 584 Catalina Cir Unit 9, Vallejo, CA 94589 and is currently estimated at $631,807, approximately $318 per square foot. 584 Catalina Cir Unit 9 is a home located in Solano County with nearby schools including Dan Mini Elementary School, Solano Middle School, and Vallejo High School.
Ownership History
Date
Name
Owned For
Owner Type
Purchase Details
Closed on
Jul 25, 2023
Sold by
Abuda Gil Alday
Bought by
Gil Alday Abuda Revocable Trust and Abuda
Current Estimated Value
Purchase Details
Closed on
Aug 2, 2002
Sold by
Abuda Gil A and Abuda Gerardo A
Bought by
Abuda Gil A and Abuda Mary Anne G
Home Financials for this Owner
Home Financials are based on the most recent Mortgage that was taken out on this home.
Original Mortgage
$180,000
Interest Rate
6.52%
Purchase Details
Closed on
Apr 20, 1999
Sold by
Abuda Arowena M
Bought by
Abuda Gerardo A
Purchase Details
Closed on
Jan 25, 1999
Sold by
Abuda Fortunata A and Reyes Antonio
Bought by
Abuda Gil A and Abuda Gerardo A
Home Financials for this Owner
Home Financials are based on the most recent Mortgage that was taken out on this home.
Original Mortgage
$144,000
Interest Rate
6.98%
Create a Home Valuation Report for This Property
The Home Valuation Report is an in-depth analysis detailing your home's value as well as a comparison with similar homes in the area
Home Values in the Area
Average Home Value in this Area
Purchase History
| Date | Buyer | Sale Price | Title Company |
|---|---|---|---|
| Gil Alday Abuda Revocable Trust | -- | None Listed On Document | |
| Abuda Gil A | $83,000 | Frontier Title Company | |
| Abuda Gerardo A | -- | Fidelity National Title Co | |
| Abuda Gil A | $46,500 | Fidelity National Title Co |
Source: Public Records
Mortgage History
| Date | Status | Borrower | Loan Amount |
|---|---|---|---|
| Previous Owner | Abuda Gil A | $180,000 | |
| Previous Owner | Abuda Gil A | $144,000 | |
| Closed | Abuda Gil A | $27,000 |
Source: Public Records
Tax History Compared to Growth
Tax History
| Year | Tax Paid | Tax Assessment Tax Assessment Total Assessment is a certain percentage of the fair market value that is determined by local assessors to be the total taxable value of land and additions on the property. | Land | Improvement |
|---|---|---|---|---|
| 2025 | $5,454 | $376,714 | $100,131 | $276,583 |
| 2024 | $5,454 | $369,328 | $98,168 | $271,160 |
| 2023 | $5,163 | $362,088 | $96,244 | $265,844 |
| 2022 | $5,077 | $354,989 | $94,357 | $260,632 |
| 2021 | $4,969 | $348,029 | $92,507 | $255,522 |
| 2020 | $4,999 | $344,461 | $91,559 | $252,902 |
| 2019 | $4,860 | $337,708 | $89,764 | $247,944 |
| 2018 | $4,565 | $331,087 | $88,004 | $243,083 |
| 2017 | $4,376 | $324,596 | $86,279 | $238,317 |
| 2016 | $3,809 | $318,233 | $84,588 | $233,645 |
| 2015 | $3,710 | $309,000 | $77,000 | $232,000 |
| 2014 | $3,168 | $260,000 | $65,000 | $195,000 |
Source: Public Records
Map
Nearby Homes
- 485 Avalon Cir
- 141 Albatrosse Way
- 289 Catalina Way
- 121 Yankee Jim Ct
- 149 Drytown Ct
- 1634 Severus Dr
- 115 Kilty Ct
- 1863 Mini Dr
- 442 Northrup Ln
- 160 Shari Ct
- 140 Boggs Ct
- 316 Meadows Dr
- 2117 Elliott Dr
- 177 Brophy St
- 205 Marla Dr
- 2041 Severus Dr
- 240 Rinaldo Dr
- 706 Capra Dr
- 111 Spencer St
- 121 Forsythia Ct
- 578 Catalina Cir
- 590 Catalina Cir
- 572 Catalina Cir
- 596 Catalina Cir
- 281 Avalon Cir
- 271 Avalon Cir
- 291 Avalon Cir
- 566 Catalina Cir
- 261 Avalon Cir
- 598 Catalina Cir
- 295 Avalon Cir
- 251 Avalon Cir
- 560 Catalina Cir
- 241 Avalon Cir
- 554 Catalina Cir
- 301 Avalon Cir
- 231 Avalon Cir
- 548 Catalina Cir
- 606 Catalina Cir