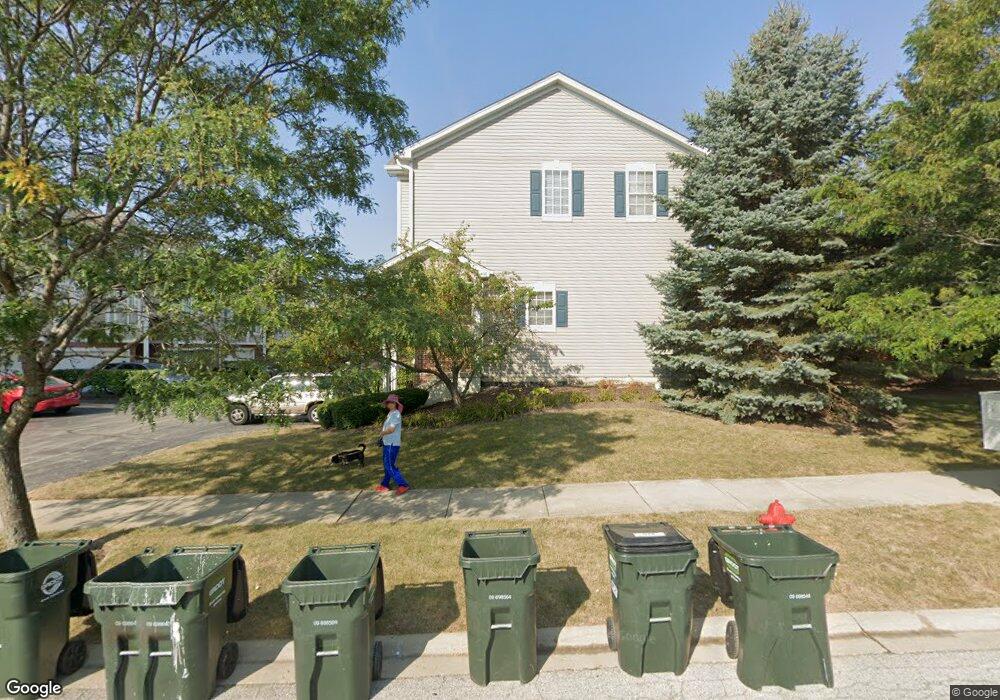
584 Declaration Ln Unit 604 Aurora, IL 60502
Eola Yards NeighborhoodEstimated Value: $306,000 - $353,000
3
Beds
3
Baths
1,588
Sq Ft
$209/Sq Ft
Est. Value
About This Home
This home is located at 584 Declaration Ln Unit 604, Aurora, IL 60502 and is currently estimated at $332,670, approximately $209 per square foot. 584 Declaration Ln Unit 604 is a home located in DuPage County with nearby schools including Nancy Young Elementary School, Francis Granger Middle School, and Metea Valley High School.
Ownership History
Date
Name
Owned For
Owner Type
Purchase Details
Closed on
Jun 20, 2008
Sold by
Kuang Kuiyang and Dang Xiao Jun
Bought by
Fox Velda L
Current Estimated Value
Home Financials for this Owner
Home Financials are based on the most recent Mortgage that was taken out on this home.
Original Mortgage
$103,810
Interest Rate
6.04%
Mortgage Type
Purchase Money Mortgage
Purchase Details
Closed on
Jun 19, 2002
Sold by
Wiseman Hughes Enterprises Inc
Bought by
Kuang Kuiyang and Dang Xiao Jun
Home Financials for this Owner
Home Financials are based on the most recent Mortgage that was taken out on this home.
Original Mortgage
$146,700
Interest Rate
6.82%
Create a Home Valuation Report for This Property
The Home Valuation Report is an in-depth analysis detailing your home's value as well as a comparison with similar homes in the area
Home Values in the Area
Average Home Value in this Area
Purchase History
| Date | Buyer | Sale Price | Title Company |
|---|---|---|---|
| Fox Velda L | $197,000 | Ticor Title Insurance Co | |
| Kuang Kuiyang | $183,500 | -- |
Source: Public Records
Mortgage History
| Date | Status | Borrower | Loan Amount |
|---|---|---|---|
| Previous Owner | Fox Velda L | $103,810 | |
| Previous Owner | Kuang Kuiyang | $146,700 |
Source: Public Records
Tax History
| Year | Tax Paid | Tax Assessment Tax Assessment Total Assessment is a certain percentage of the fair market value that is determined by local assessors to be the total taxable value of land and additions on the property. | Land | Improvement |
|---|---|---|---|---|
| 2024 | $6,604 | $94,852 | $20,210 | $74,642 |
| 2023 | $6,276 | $85,230 | $18,160 | $67,070 |
| 2022 | $5,809 | $75,270 | $16,040 | $59,230 |
| 2021 | $5,649 | $72,590 | $15,470 | $57,120 |
| 2020 | $5,718 | $72,590 | $15,470 | $57,120 |
| 2019 | $5,507 | $69,040 | $14,710 | $54,330 |
| 2018 | $5,210 | $64,990 | $13,850 | $51,140 |
| 2017 | $5,117 | $62,790 | $13,380 | $49,410 |
| 2016 | $5,017 | $60,260 | $12,840 | $47,420 |
| 2015 | $4,954 | $57,210 | $12,190 | $45,020 |
| 2014 | $4,869 | $54,870 | $11,690 | $43,180 |
| 2013 | $4,821 | $55,250 | $11,770 | $43,480 |
Source: Public Records
Map
Nearby Homes
- 2321 Hudson Cir Unit 2701
- 2314 Reflections Dr Unit C0602
- 1900 E New York St
- 2333 Stoughton Cir Unit 350206
- 452 Jamestown Ct Unit 506
- 530 Wolverine Dr
- 1048 Asbury Dr
- 369 Vaughn Cir
- 255 Vaughn Rd
- 253 Vaughn Rd
- 251 Vaughn Rd
- 249 Vaughn Rd
- 229 Vaughn Rd
- 247 Vaughn Rd
- 227 Vaughn Rd
- 45 Brookshire Ct
- 23 Westmoor Ct
- 38 Breckenridge Dr
- 1015 Woodview Ct
- 33 Forestview Ln
- 582 Declaration Ln Unit 603
- 586 Declaration Ln Unit 605
- 580 Declaration Ln Unit 602
- 580 Declaration Ln
- 578 Declaration Ln Unit 601
- 570 Declaration Ln Unit 702
- 588 Declaration Ln Unit 501
- 572 Declaration Ln Unit 703
- 568 Declaration Ln Unit 701
- 590 Declaration Ln Unit 502
- 592 Declaration Ln Unit 503
- 574 Declaration Ln Unit 704
- 594 Declaration Ln Unit 504
- 576 Declaration Ln Unit 705
- 576 Declaration Ln
- 596 Declaration Ln Unit 505
- 589 Declaration Ln Unit 1601
- 564 Declaration Ln Unit 804
- 562 Declaration Ln Unit 803
- 562 Declaration Ln Unit 562
Your Personal Tour Guide
Ask me questions while you tour the home.