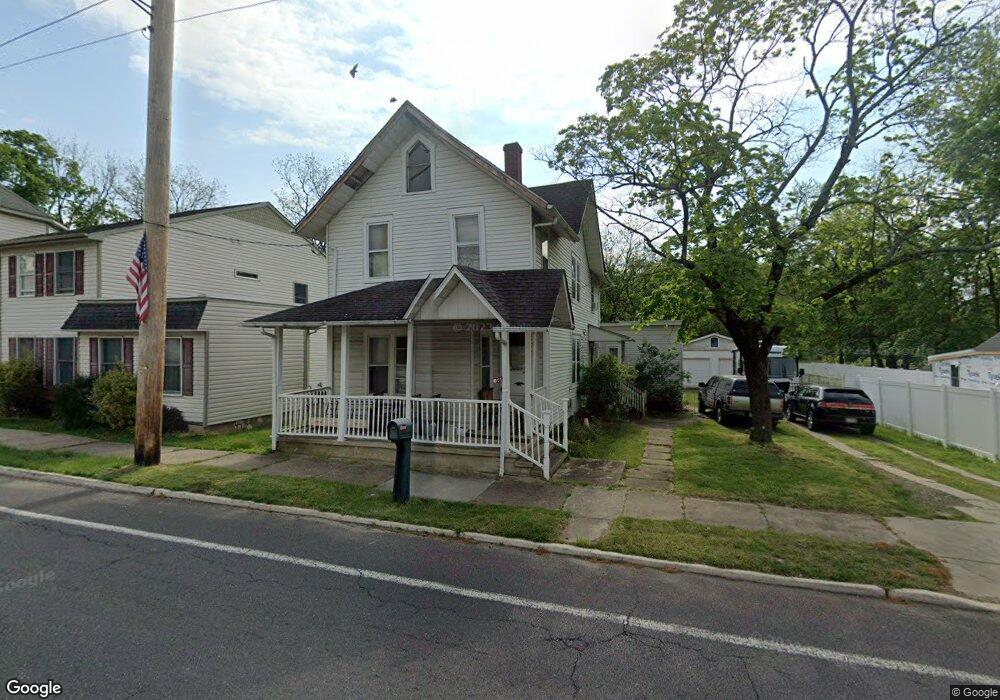
584 Main St Lumberton, NJ 08048
Estimated Value: $319,165 - $409,000
Studio
--
Bath
1,710
Sq Ft
$218/Sq Ft
Est. Value
About This Home
This home is located at 584 Main St, Lumberton, NJ 08048 and is currently estimated at $372,541, approximately $217 per square foot. 584 Main St is a home located in Burlington County with nearby schools including Ashbrook Elementary School, Bobby’s Run School, and Lumberton Middle School.
Ownership History
Date
Name
Owned For
Owner Type
Purchase Details
Closed on
Dec 20, 1996
Sold by
Staff Frank P
Bought by
Staff Frank F and Staff Susan L
Current Estimated Value
Create a Home Valuation Report for This Property
The Home Valuation Report is an in-depth analysis detailing your home's value as well as a comparison with similar homes in the area
Home Values in the Area
Average Home Value in this Area
Purchase History
| Date | Buyer | Sale Price | Title Company |
|---|---|---|---|
| Staff Frank F | -- | Legal Title |
Source: Public Records
Tax History
| Year | Tax Paid | Tax Assessment Tax Assessment Total Assessment is a certain percentage of the fair market value that is determined by local assessors to be the total taxable value of land and additions on the property. | Land | Improvement |
|---|---|---|---|---|
| 2025 | $5,513 | $207,100 | $73,000 | $134,100 |
| 2024 | $5,184 | $207,100 | $73,000 | $134,100 |
| 2023 | $5,184 | $207,100 | $73,000 | $134,100 |
| 2022 | $5,064 | $207,100 | $73,000 | $134,100 |
| 2021 | $4,662 | $207,100 | $73,000 | $134,100 |
| 2020 | $5,006 | $207,100 | $73,000 | $134,100 |
| 2019 | $4,950 | $207,100 | $73,000 | $134,100 |
| 2018 | $4,875 | $207,100 | $73,000 | $134,100 |
| 2017 | $4,784 | $207,100 | $73,000 | $134,100 |
| 2016 | $4,680 | $207,100 | $73,000 | $134,100 |
| 2015 | $4,645 | $207,100 | $73,000 | $134,100 |
| 2014 | $4,469 | $207,100 | $73,000 | $134,100 |
Source: Public Records
Map
Nearby Homes
Your Personal Tour Guide
Ask me questions while you tour the home.