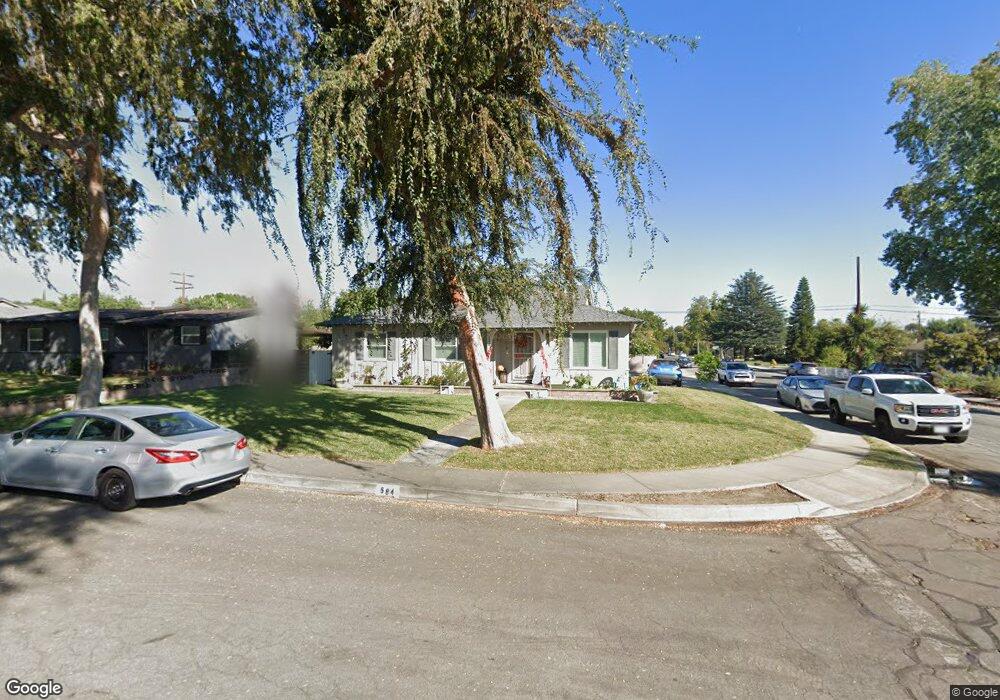
584 N Vallejo Way Upland, CA 91786
Estimated Value: $668,000 - $789,000
4
Beds
3
Baths
1,785
Sq Ft
$415/Sq Ft
Est. Value
About This Home
This home is located at 584 N Vallejo Way, Upland, CA 91786 and is currently estimated at $740,402, approximately $414 per square foot. 584 N Vallejo Way is a home located in San Bernardino County with nearby schools including Baldy View Elementary School, Upland Junior High School, and Upland High School.
Ownership History
Date
Name
Owned For
Owner Type
Purchase Details
Closed on
May 24, 2007
Sold by
Dewitt John P and Dewitt Nancy J
Bought by
Dewitt John Patrick and Dewitt Nancy Jean
Current Estimated Value
Purchase Details
Closed on
Mar 9, 2005
Sold by
Dewitt John P
Bought by
Dewitt John P and Dewitt Nancy J
Home Financials for this Owner
Home Financials are based on the most recent Mortgage that was taken out on this home.
Original Mortgage
$100,000
Interest Rate
5.61%
Mortgage Type
Credit Line Revolving
Purchase Details
Closed on
Jul 7, 2003
Sold by
Dewitt Nancy J
Bought by
Dewitt John P
Home Financials for this Owner
Home Financials are based on the most recent Mortgage that was taken out on this home.
Original Mortgage
$248,000
Interest Rate
5.18%
Mortgage Type
Purchase Money Mortgage
Create a Home Valuation Report for This Property
The Home Valuation Report is an in-depth analysis detailing your home's value as well as a comparison with similar homes in the area
Home Values in the Area
Average Home Value in this Area
Purchase History
| Date | Buyer | Sale Price | Title Company |
|---|---|---|---|
| Dewitt John Patrick | -- | None Available | |
| Dewitt John P | -- | -- | |
| Dewitt John P | -- | Commonwealth Title |
Source: Public Records
Mortgage History
| Date | Status | Borrower | Loan Amount |
|---|---|---|---|
| Closed | Dewitt John P | $100,000 | |
| Closed | Dewitt John P | $248,000 |
Source: Public Records
Tax History Compared to Growth
Tax History
| Year | Tax Paid | Tax Assessment Tax Assessment Total Assessment is a certain percentage of the fair market value that is determined by local assessors to be the total taxable value of land and additions on the property. | Land | Improvement |
|---|---|---|---|---|
| 2025 | $5,770 | $243,951 | $37,531 | $206,420 |
| 2024 | $5,770 | $239,168 | $36,795 | $202,373 |
| 2023 | $5,727 | $234,479 | $36,074 | $198,405 |
| 2022 | $5,669 | $229,882 | $35,367 | $194,515 |
| 2021 | $5,661 | $225,375 | $34,674 | $190,701 |
| 2020 | $5,592 | $223,064 | $34,318 | $188,746 |
| 2019 | $5,582 | $218,690 | $33,645 | $185,045 |
| 2018 | $5,523 | $214,402 | $32,985 | $181,417 |
| 2017 | $5,412 | $210,198 | $32,338 | $177,860 |
| 2016 | $5,194 | $206,077 | $31,704 | $174,373 |
| 2015 | $2,105 | $202,982 | $31,228 | $171,754 |
| 2014 | $2,050 | $199,006 | $30,616 | $168,390 |
Source: Public Records
Map
Nearby Homes
- 125 Towns Ave
- 0 Bay St Unit AR25093919
- 435 W 9th St Unit F5
- 435 W 9th St Unit B3
- 537 W 9th St
- 910 N Redding Way Unit F
- 855 N Palm Ave
- 595 Juniper Ave
- 928 N Redding Way Unit D
- 681 Birch Ave
- 939 W Pine St Unit 44
- 164 Euclid Place
- 1090 Springfield St
- Plan 3 at Towns on First - Towns On First
- Plan 4 at Towns on First - Towns On First
- 691 N 3rd Ave
- 173 W 8th St
- 119 N 1st Ave
- 1234 N Laurel Ave
- 228 Greentree Rd
- 600 N Vallejo Way
- 614 N Vallejo Way
- 583 N Ukiah Way
- 601 N Ukiah Way
- 704 Winn Dr
- 690 Winn Dr
- 585 N Vallejo Way
- 724 Winn Dr
- 617 N Ukiah Way
- 672 Winn Dr
- 601 N Vallejo Way
- 628 N Vallejo Way
- 742 Winn Dr
- 617 N Vallejo Way
- 654 Winn Dr
- 629 N Ukiah Way
- 644 N Vallejo Way
- 758 Winn Dr
- 634 Winn Dr
- 645 N Ukiah Way