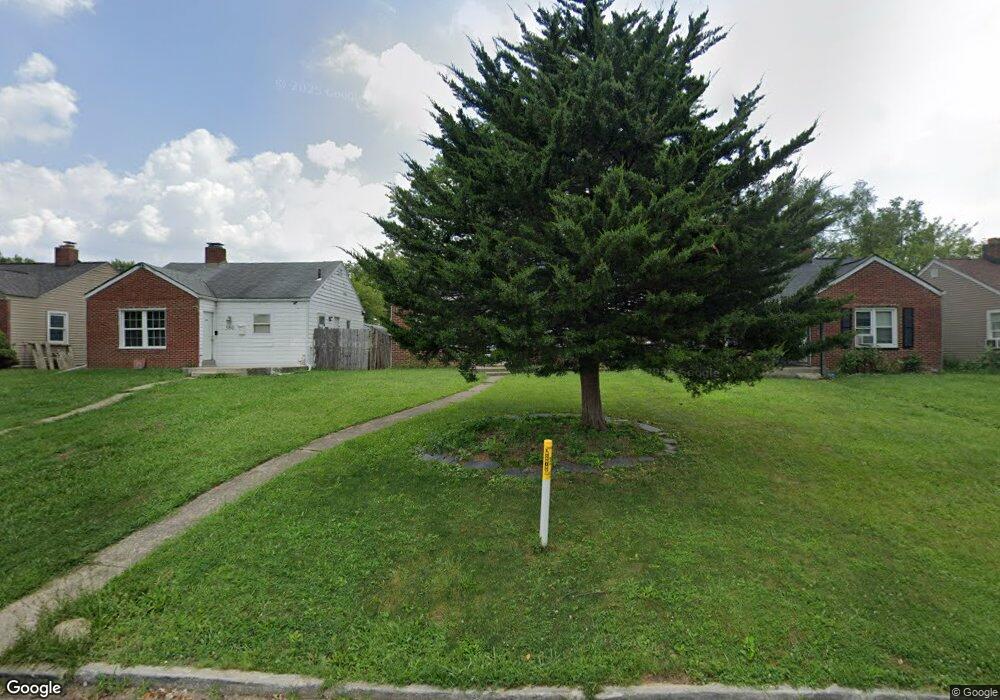
584 Whitethorne Ave Columbus, OH 43223
South Hilltop NeighborhoodEstimated Value: $92,551 - $143,000
2
Beds
1
Bath
732
Sq Ft
$168/Sq Ft
Est. Value
About This Home
This home is located at 584 Whitethorne Ave, Columbus, OH 43223 and is currently estimated at $122,638, approximately $167 per square foot. 584 Whitethorne Ave is a home located in Franklin County with nearby schools including West Mound Elementary School, Hilltonia Middle School, and Briggs High School.
Ownership History
Date
Name
Owned For
Owner Type
Purchase Details
Closed on
Mar 12, 2010
Sold by
Federal Home Loan Mortgage Corporation
Bought by
Equity Trust Co
Current Estimated Value
Purchase Details
Closed on
Feb 18, 2010
Sold by
Parise Sharon K
Bought by
Federal Home Loan Mortgage Corp
Purchase Details
Closed on
Sep 21, 2006
Sold by
Blue Sky Homes Llc
Bought by
Parise Sharon K
Purchase Details
Closed on
Apr 21, 2004
Sold by
Household Realty Corp
Bought by
Blue Sky Homes Llc
Purchase Details
Closed on
Nov 5, 2003
Sold by
Stamper Jack and Case #03Cve01 1263
Bought by
Household Realty Corp
Create a Home Valuation Report for This Property
The Home Valuation Report is an in-depth analysis detailing your home's value as well as a comparison with similar homes in the area
Home Values in the Area
Average Home Value in this Area
Purchase History
| Date | Buyer | Sale Price | Title Company |
|---|---|---|---|
| Equity Trust Co | $9,000 | Attorney | |
| Federal Home Loan Mortgage Corp | $20,000 | None Available | |
| Parise Sharon K | $75,000 | Premiere | |
| Blue Sky Homes Llc | $38,000 | Foundation Title Agency Inc | |
| Household Realty Corp | $40,000 | -- |
Source: Public Records
Tax History
| Year | Tax Paid | Tax Assessment Tax Assessment Total Assessment is a certain percentage of the fair market value that is determined by local assessors to be the total taxable value of land and additions on the property. | Land | Improvement |
|---|---|---|---|---|
| 2025 | $1,365 | $29,790 | $5,670 | $24,120 |
| 2024 | $1,365 | $29,790 | $5,670 | $24,120 |
| 2023 | $1,348 | $29,785 | $5,670 | $24,115 |
| 2022 | $759 | $14,290 | $1,930 | $12,360 |
| 2021 | $761 | $14,290 | $1,930 | $12,360 |
| 2020 | $762 | $14,290 | $1,930 | $12,360 |
| 2019 | $703 | $11,310 | $1,610 | $9,700 |
| 2018 | $351 | $11,310 | $1,610 | $9,700 |
| 2017 | $703 | $11,310 | $1,610 | $9,700 |
| 2016 | $404 | $5,950 | $4,480 | $1,470 |
| 2015 | $184 | $5,950 | $4,480 | $1,470 |
| 2014 | $571 | $9,210 | $4,480 | $4,730 |
| 2013 | $332 | $10,850 | $5,285 | $5,565 |
Source: Public Records
Map
Nearby Homes
- 530 Whitethorne Ave
- 611 Whitethorne Ave
- 561 Belvidere Ave
- 485 Belvidere Ave
- 510 Belvidere Ave
- 2182 Homewood Ave
- 2247 Safford Ave
- 624 Wrexham Ave
- 543 Hilltonia Ave
- 545-547 S Highland Ave Unit 545
- 2023 Sullivant Ave Unit 2025
- 2009 Sullivant Ave Unit 9
- 632 Hilltonia Ave
- 538 S Wheatland Ave
- 479 Nashoba Ave
- 637 S Wheatland Ave Unit 639
- 780-782 Whitethorne Ave
- 608 Nashoba Ave
- 1543 Safford Ave
- 558 S Oakley Ave Unit 60
- 580 Whitethorne Ave
- 590 Whitethorne Ave
- 574 Whitethorne Ave
- 594 Whitethorne Ave
- 600 Whitethorne Ave
- 568 Whitethorne Ave
- 579 Butler Ave
- 573 Butler Ave
- 585 Butler Ave
- 604 Whitethorne Ave
- 564 Whitethorne Ave
- 589 Butler Ave
- 567 Butler Ave
- 599 Whitethorne Ave Unit 601
- 593 Butler Ave
- 561 Butler Ave
- 589 Whitethorne Ave Unit 591
- 575 Whitethorne Ave
- 593 Whitethorne Ave Unit 595
- 558 Whitethorne Ave
Your Personal Tour Guide
Ask me questions while you tour the home.