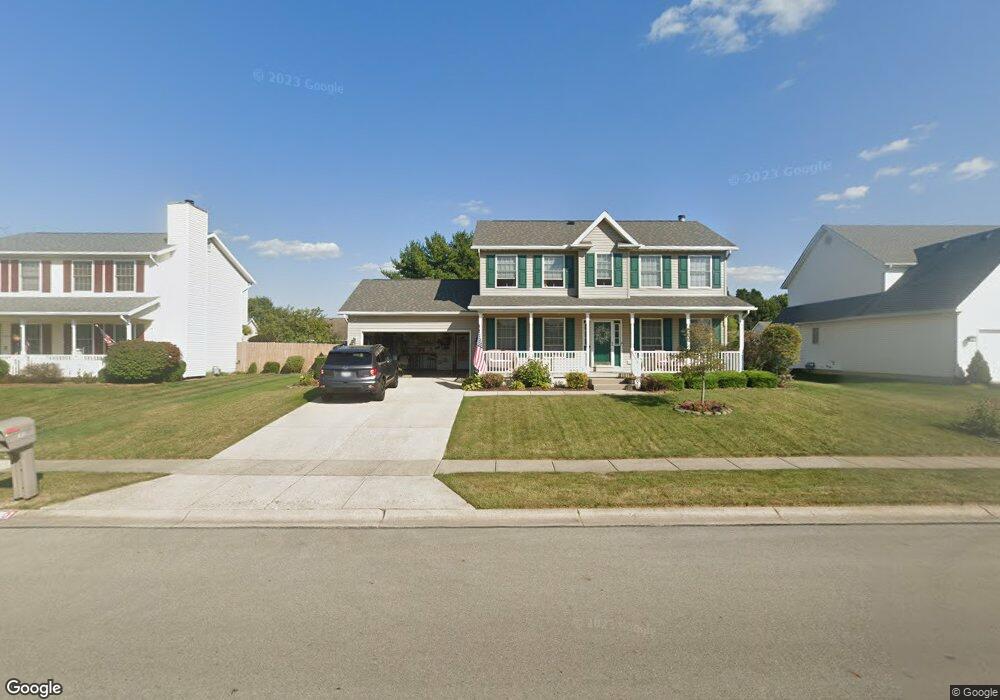
5840 Ridgewood Rd W Springfield, OH 45502
Estimated Value: $321,678 - $396,000
3
Beds
3
Baths
1,990
Sq Ft
$178/Sq Ft
Est. Value
About This Home
This home is located at 5840 Ridgewood Rd W, Springfield, OH 45502 and is currently estimated at $354,420, approximately $178 per square foot. 5840 Ridgewood Rd W is a home located in Clark County with nearby schools including Rolling Hills Elementary School, Northridge Middle School, and Kenton Ridge Middle & High School.
Ownership History
Date
Name
Owned For
Owner Type
Purchase Details
Closed on
Apr 5, 2007
Sold by
Shively Robert M
Bought by
Stannard Michael P and Stannard Tracy L
Current Estimated Value
Home Financials for this Owner
Home Financials are based on the most recent Mortgage that was taken out on this home.
Original Mortgage
$158,400
Outstanding Balance
$96,036
Interest Rate
6.2%
Mortgage Type
Purchase Money Mortgage
Estimated Equity
$258,384
Purchase Details
Closed on
Sep 28, 2003
Sold by
Shively Heidi S
Bought by
Shively Robert M
Purchase Details
Closed on
Aug 16, 2002
Sold by
Weldon G Haney Builders Inc
Bought by
Shively Robert M and Shively Heidi S
Home Financials for this Owner
Home Financials are based on the most recent Mortgage that was taken out on this home.
Original Mortgage
$166,619
Interest Rate
6.64%
Mortgage Type
Purchase Money Mortgage
Create a Home Valuation Report for This Property
The Home Valuation Report is an in-depth analysis detailing your home's value as well as a comparison with similar homes in the area
Home Values in the Area
Average Home Value in this Area
Purchase History
| Date | Buyer | Sale Price | Title Company |
|---|---|---|---|
| Stannard Michael P | $198,000 | Attorney | |
| Shively Robert M | -- | -- | |
| Shively Robert M | $175,400 | -- |
Source: Public Records
Mortgage History
| Date | Status | Borrower | Loan Amount |
|---|---|---|---|
| Open | Stannard Michael P | $158,400 | |
| Closed | Shively Robert M | $166,619 |
Source: Public Records
Tax History Compared to Growth
Tax History
| Year | Tax Paid | Tax Assessment Tax Assessment Total Assessment is a certain percentage of the fair market value that is determined by local assessors to be the total taxable value of land and additions on the property. | Land | Improvement |
|---|---|---|---|---|
| 2024 | $3,322 | $78,560 | $17,700 | $60,860 |
| 2023 | $3,322 | $78,560 | $17,700 | $60,860 |
| 2022 | $3,334 | $78,560 | $17,700 | $60,860 |
| 2021 | $3,506 | $70,000 | $13,510 | $56,490 |
| 2020 | $3,509 | $70,000 | $13,510 | $56,490 |
| 2019 | $4,233 | $82,870 | $13,510 | $69,360 |
| 2018 | $3,545 | $66,620 | $13,510 | $53,110 |
| 2017 | $3,038 | $69,108 | $13,514 | $55,594 |
| 2016 | $3,017 | $69,108 | $13,514 | $55,594 |
| 2015 | $3,099 | $67,421 | $13,514 | $53,907 |
| 2014 | $3,099 | $67,421 | $13,514 | $53,907 |
| 2013 | $3,027 | $67,421 | $13,514 | $53,907 |
Source: Public Records
Map
Nearby Homes
- 5794 Winfield Dr
- 1470 Oldham Dr Unit 12
- 1527 Oldham Dr
- 1902 Willow Lakes Dr Unit 71
- 1888 Birchwood Ct
- 5249 Taywell Dr
- 5220 Ridgewood Rd E
- 5127 Stoneridge Dr
- 1709 Thomas Dr
- 4825 Chippendale Dr
- 4849 Ashley Dr
- 4740 Merrimont Ave
- 4924 Brannan Dr E Unit 4924
- 4622 W Ridgewood Rd
- 4620 Eldora St
- 4620 Eldora Dr
- 880 Brendle Trace Unit 28
- 4524 Ridgewood Rd E
- 4512 Ridgewood Rd E
- 5856 Ridgewood Rd W
- 5824 Ridgewood Rd W
- 5824 W Ridgewood Rd
- 5807 Winfield Dr
- 5815 Winfield Dr Unit 53
- 5799 Winfield Dr Unit 51
- 5872 Ridgewood Rd W
- 5872 W Ridgewood Rd
- 5808 Ridgewood Rd W
- 5847 Ridgewood Rd W
- 5823 Winfield Dr Unit 54
- 5823 Winfield Dr
- 5831 Ridgewood Rd W
- 5791 Winfield Dr
- 5791 Winfield Dr Unit 50
- 5863 Ridgewood Rd W
- 5815 Ridgewood Rd W
- 5792 Ridgewood Rd W
- 1347 Willow Chase Ct
- 5802 Winfield Dr Unit 57