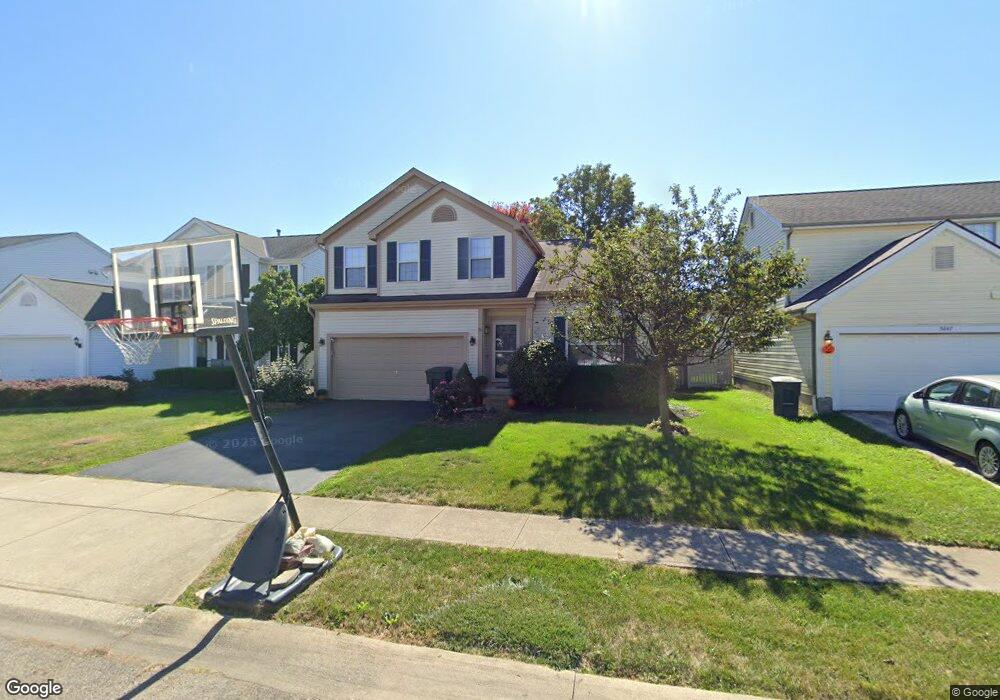
5841 Clover Groff Dr Hilliard, OH 43026
Westbrooke NeighborhoodEstimated Value: $382,000 - $425,000
3
Beds
3
Baths
1,813
Sq Ft
$225/Sq Ft
Est. Value
About This Home
This home is located at 5841 Clover Groff Dr, Hilliard, OH 43026 and is currently estimated at $407,476, approximately $224 per square foot. 5841 Clover Groff Dr is a home located in Franklin County with nearby schools including Hilliard Station Sixth Grade Elementary School, Hilliard Memorial Middle School, and Hilliard Bradley High School.
Ownership History
Date
Name
Owned For
Owner Type
Purchase Details
Closed on
Jan 19, 2005
Sold by
Miller John David and Miller Crystal
Bought by
Buckley Michael G and Buckley Sheila D
Current Estimated Value
Purchase Details
Closed on
Jul 30, 2003
Sold by
Ries Matthew W and Ries Sherry L
Bought by
Miller John David
Home Financials for this Owner
Home Financials are based on the most recent Mortgage that was taken out on this home.
Original Mortgage
$146,320
Outstanding Balance
$50,943
Interest Rate
2.75%
Mortgage Type
Purchase Money Mortgage
Estimated Equity
$356,533
Purchase Details
Closed on
Sep 17, 1999
Sold by
M/I Schottenstein Homes Inc
Bought by
Ries Matthew W and Ries Sherry L
Home Financials for this Owner
Home Financials are based on the most recent Mortgage that was taken out on this home.
Original Mortgage
$142,350
Interest Rate
8.21%
Create a Home Valuation Report for This Property
The Home Valuation Report is an in-depth analysis detailing your home's value as well as a comparison with similar homes in the area
Home Values in the Area
Average Home Value in this Area
Purchase History
| Date | Buyer | Sale Price | Title Company |
|---|---|---|---|
| Buckley Michael G | $195,500 | Chicago Tit | |
| Miller John David | $182,900 | -- | |
| Ries Matthew W | $161,900 | Transohio Residential Title |
Source: Public Records
Mortgage History
| Date | Status | Borrower | Loan Amount |
|---|---|---|---|
| Open | Miller John David | $146,320 | |
| Previous Owner | Ries Matthew W | $142,350 |
Source: Public Records
Tax History Compared to Growth
Tax History
| Year | Tax Paid | Tax Assessment Tax Assessment Total Assessment is a certain percentage of the fair market value that is determined by local assessors to be the total taxable value of land and additions on the property. | Land | Improvement |
|---|---|---|---|---|
| 2024 | $6,510 | $115,260 | $35,700 | $79,560 |
| 2023 | $5,639 | $115,255 | $35,700 | $79,555 |
| 2022 | $5,268 | $86,210 | $12,600 | $73,610 |
| 2021 | $5,263 | $86,210 | $12,600 | $73,610 |
| 2020 | $5,248 | $86,210 | $12,600 | $73,610 |
| 2019 | $4,963 | $69,620 | $10,080 | $59,540 |
| 2018 | $4,751 | $69,620 | $10,080 | $59,540 |
| 2017 | $4,903 | $69,620 | $10,080 | $59,540 |
| 2016 | $4,864 | $63,460 | $13,930 | $49,530 |
| 2015 | $4,559 | $63,460 | $13,930 | $49,530 |
| 2014 | $4,567 | $63,460 | $13,930 | $49,530 |
| 2013 | $2,204 | $60,445 | $13,265 | $47,180 |
Source: Public Records
Map
Nearby Homes
- 5990 Hampton Corners N
- 3395 Heritage Oaks Dr
- 6067 Nova Park Ln
- 5686 Moonpenny Ln
- 2735 Quailview Ln
- 5644 Newington Dr
- 5962 Heritage Lakes Dr
- 2886 Wynneleaf St
- 2880 Wynneleaf St
- 5605 Brickstone Place Unit 75605
- 6056 Glade Run Rd
- 2654 Brittany Oaks Blvd
- 2657 Amberwick Place
- 2650 Brittany Oaks Blvd
- 2643 Westrock Dr
- 3127 Stouenburgh Dr
- 5606 Oldwynne Rd
- 5488 Whispering Oak Blvd
- 5341 Hyde Park Dr
- 2603 Westrock Dr
- 5835 Clover Groff Dr
- 5847 Clover Groff Dr
- 5829 Clover Groff Dr
- 5834 Dena Dr
- 5828 Dena Dr
- 5846 Dena Dr
- 3136 Andrew James Dr
- 5822 Dena Dr
- 5836 Clover Groff Dr
- 5816 Dena Dr
- 5817 Clover Groff Dr
- 5830 Clover Groff Dr
- 3125 Andrew James Dr
- 3119 Andrew James Dr
- 3131 Andrew James Dr
- 5824 Clover Groff Dr
- 3142 Andrew James Dr
- 5810 Dena Dr
- 3105 Andrew James Dr
- 5811 Clover Groff Dr