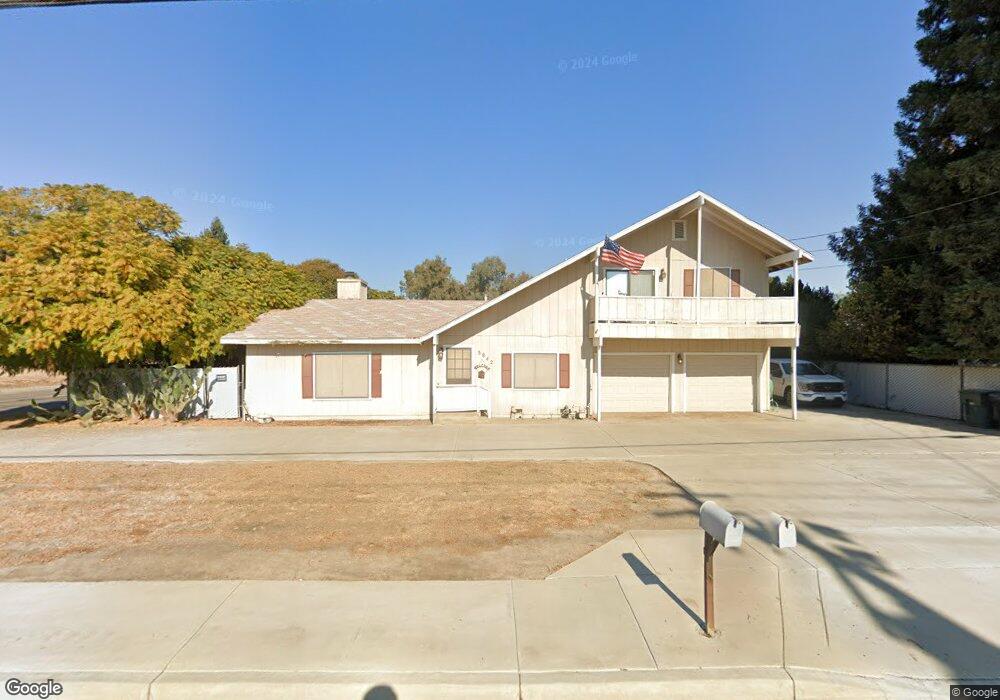
5842 W Hurley Ave Visalia, CA 93291
Northwest Visalia NeighborhoodEstimated Value: $371,000 - $555,000
4
Beds
3
Baths
2,080
Sq Ft
$233/Sq Ft
Est. Value
About This Home
This home is located at 5842 W Hurley Ave, Visalia, CA 93291 and is currently estimated at $484,095, approximately $232 per square foot. 5842 W Hurley Ave is a home located in Tulare County with nearby schools including Hurley Elementary School, Ridgeview Middle, and Redwood High School.
Ownership History
Date
Name
Owned For
Owner Type
Purchase Details
Closed on
Jan 28, 2015
Sold by
Andreas Heather Chantelle
Bought by
Andreas Anthony Scott
Current Estimated Value
Home Financials for this Owner
Home Financials are based on the most recent Mortgage that was taken out on this home.
Original Mortgage
$223,500
Outstanding Balance
$171,381
Interest Rate
3.87%
Mortgage Type
New Conventional
Estimated Equity
$312,714
Purchase Details
Closed on
Dec 31, 2014
Sold by
Andreas Cora M
Bought by
Andreas Cora May
Home Financials for this Owner
Home Financials are based on the most recent Mortgage that was taken out on this home.
Original Mortgage
$223,500
Outstanding Balance
$171,381
Interest Rate
3.87%
Mortgage Type
New Conventional
Estimated Equity
$312,714
Purchase Details
Closed on
Mar 21, 2007
Sold by
Correa Susana
Bought by
Andreas Cora M and Andreas Anthony Scott
Create a Home Valuation Report for This Property
The Home Valuation Report is an in-depth analysis detailing your home's value as well as a comparison with similar homes in the area
Home Values in the Area
Average Home Value in this Area
Purchase History
| Date | Buyer | Sale Price | Title Company |
|---|---|---|---|
| Andreas Anthony Scott | -- | None Available | |
| Andreas Cora May | -- | Chicago Title Company | |
| Andreas Cora M | -- | Fidelity Natl Title Co Of Ca |
Source: Public Records
Mortgage History
| Date | Status | Borrower | Loan Amount |
|---|---|---|---|
| Open | Andreas Cora May | $223,500 |
Source: Public Records
Tax History Compared to Growth
Tax History
| Year | Tax Paid | Tax Assessment Tax Assessment Total Assessment is a certain percentage of the fair market value that is determined by local assessors to be the total taxable value of land and additions on the property. | Land | Improvement |
|---|---|---|---|---|
| 2025 | $1,134 | $113,946 | $22,067 | $91,879 |
| 2024 | $1,134 | $111,713 | $21,635 | $90,078 |
| 2023 | $1,101 | $109,523 | $21,211 | $88,312 |
| 2022 | $1,066 | $107,377 | $20,796 | $86,581 |
| 2021 | $1,051 | $105,271 | $20,388 | $84,883 |
| 2020 | $1,035 | $104,192 | $20,179 | $84,013 |
| 2019 | $1,010 | $102,149 | $19,783 | $82,366 |
| 2018 | $977 | $100,146 | $19,395 | $80,751 |
| 2017 | $972 | $98,183 | $19,015 | $79,168 |
| 2016 | $946 | $96,258 | $18,642 | $77,616 |
| 2015 | $916 | $94,812 | $18,362 | $76,450 |
| 2014 | $916 | $92,954 | $18,002 | $74,952 |
Source: Public Records
Map
Nearby Homes
- 6040 W Hurley Ave
- 415 N Akers St Unit 50
- 415 N Akers St Unit 117
- 415 N Akers St Unit 48
- 415 N Akers St Unit 121
- 5502 W Nicholas Ct
- 245 N Boise St
- 415 N Akers Spc 6 St
- 707 N Branson Ct
- 415 N Akers St Unit 9
- 415 N Akers St Unit 17
- 415 N Akers St Unit 84
- 5837 W Stewart Ave
- 141 N Boise Ct
- 225 N Akers St Unit 308
- 144 S Roeben Ct
- 1007 N Atwood St
- 6346 W Burrel Ct
- 5010 W Oak Ave
- 5503 W Sweet Dr
- 5824 W Hurley Ave
- 538 N Tommy St
- 0 Hurley & Tommy W Unit 20355
- 0 Hurley & Tommy W Unit 11074
- 0 Hurley & Tommy W Unit 11050
- 0 Hurley & Tommy W Unit 223622
- 535 N Cottonwood Ct
- 528 N Tommy St
- 531 N Cottonwood Ct
- 537 N Tommy St
- 623 N Cottonwood St
- 527 N Tommy St
- 518 N Tommy St
- 536 N Cottonwood Ct
- 523 N Cottonwood Ct
- 631 N Tommy St
- 5932 W Hurley Ave
- 519 N Tommy St
- 534 N Anthony Ct
- 647 N Cottonwood St