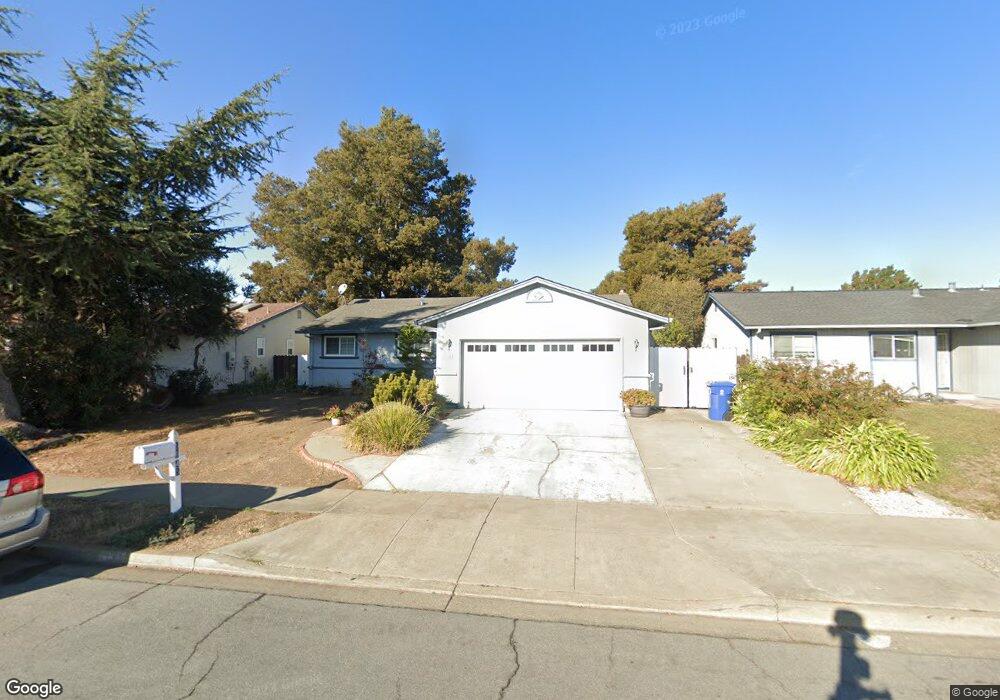
5845 Saint Matthew Dr Newark, CA 94560
Estimated Value: $1,126,000 - $1,293,000
4
Beds
2
Baths
1,464
Sq Ft
$831/Sq Ft
Est. Value
About This Home
This home is located at 5845 Saint Matthew Dr, Newark, CA 94560 and is currently estimated at $1,216,840, approximately $831 per square foot. 5845 Saint Matthew Dr is a home located in Alameda County with nearby schools including Birch Grove Intermediate School, Newark Junior High School, and Newark Memorial High School.
Ownership History
Date
Name
Owned For
Owner Type
Purchase Details
Closed on
Jun 7, 2014
Sold by
Yin Yee Kok Thonge and Yin Aung Yin
Bought by
Yee & Aung Family Trust
Current Estimated Value
Purchase Details
Closed on
Dec 15, 2011
Sold by
Castro Candice S
Bought by
Aung Yin Yin
Home Financials for this Owner
Home Financials are based on the most recent Mortgage that was taken out on this home.
Original Mortgage
$242,000
Outstanding Balance
$164,907
Interest Rate
3.93%
Mortgage Type
New Conventional
Estimated Equity
$1,051,933
Purchase Details
Closed on
Oct 10, 2011
Sold by
Yee Kok Thonge
Bought by
Aung Yin Yin
Purchase Details
Closed on
May 4, 2001
Sold by
Castro Thomas W and Castro Candice S
Bought by
Castro Candice S
Create a Home Valuation Report for This Property
The Home Valuation Report is an in-depth analysis detailing your home's value as well as a comparison with similar homes in the area
Home Values in the Area
Average Home Value in this Area
Purchase History
| Date | Buyer | Sale Price | Title Company |
|---|---|---|---|
| Yee & Aung Family Trust | -- | None Available | |
| Yin Yee Kok Thonge | -- | None Available | |
| Aung Yin Yin | $352,000 | First American Title Company | |
| Aung Yin Yin | -- | First American Title Company | |
| Castro Candice S | -- | -- |
Source: Public Records
Mortgage History
| Date | Status | Borrower | Loan Amount |
|---|---|---|---|
| Open | Aung Yin Yin | $242,000 |
Source: Public Records
Tax History
| Year | Tax Paid | Tax Assessment Tax Assessment Total Assessment is a certain percentage of the fair market value that is determined by local assessors to be the total taxable value of land and additions on the property. | Land | Improvement |
|---|---|---|---|---|
| 2025 | $5,675 | $435,107 | $132,632 | $309,475 |
| 2024 | $5,675 | $426,441 | $130,032 | $303,409 |
| 2023 | $5,512 | $424,944 | $127,483 | $297,461 |
| 2022 | $5,429 | $409,612 | $124,983 | $291,629 |
| 2021 | $5,295 | $401,446 | $122,534 | $285,912 |
| 2020 | $5,189 | $404,261 | $121,278 | $282,983 |
| 2019 | $5,116 | $396,337 | $118,901 | $277,436 |
| 2018 | $5,036 | $388,568 | $116,570 | $271,998 |
| 2017 | $4,907 | $380,951 | $114,285 | $266,666 |
| 2016 | $4,849 | $373,481 | $112,044 | $261,437 |
| 2015 | $4,831 | $367,874 | $110,362 | $257,512 |
| 2014 | $4,697 | $360,668 | $108,200 | $252,468 |
Source: Public Records
Map
Nearby Homes
- 5859 Central Ave
- 5912 Mayhews Landing Rd
- 6245 Thornton Ave
- 37640 Hyacinth St
- 37141 Saint Christopher St
- 37164 Saint Christopher St
- 6257 Honeysuckle Dr
- 6364 Noel Ave
- 36465 Hafner St
- 6048 Bellhaven Ave
- 5311 Port Sailwood Dr
- 6328 Zulmida Ave
- 5874 Caleb Ct
- 37029 Olive St
- 5268 Keeler Ct
- 5879 Caleb Ct
- 5585 Fernwood Dr
- 6252 Bennington Dr
- 36255 Casey Ct
- 36057 Dalewood Dr
- 5867 Saint Matthew Dr
- 5829 Saint Matthew Dr
- 5844 Saint Paul Dr
- 5862 Saint Paul Dr
- 5830 Saint Paul Dr
- 5881 Saint Matthew Dr
- 5813 Saint Matthew Dr
- 5888 Saint Paul Dr
- 5814 Saint Paul Dr
- 5852 Saint Matthew Dr
- 5893 Saint Matthew Dr
- 5868 Saint Matthew Dr
- 5836 Saint Matthew Dr
- 5791 Saint Matthew Dr
- 5818 St Matthiew Dr
- 5896 Saint Paul Dr
- 5886 Saint Matthew Dr
- 5796 Saint Paul Dr
- 5818 Saint Matthew Dr
- 5919 Saint Matthew Dr
Your Personal Tour Guide
Ask me questions while you tour the home.