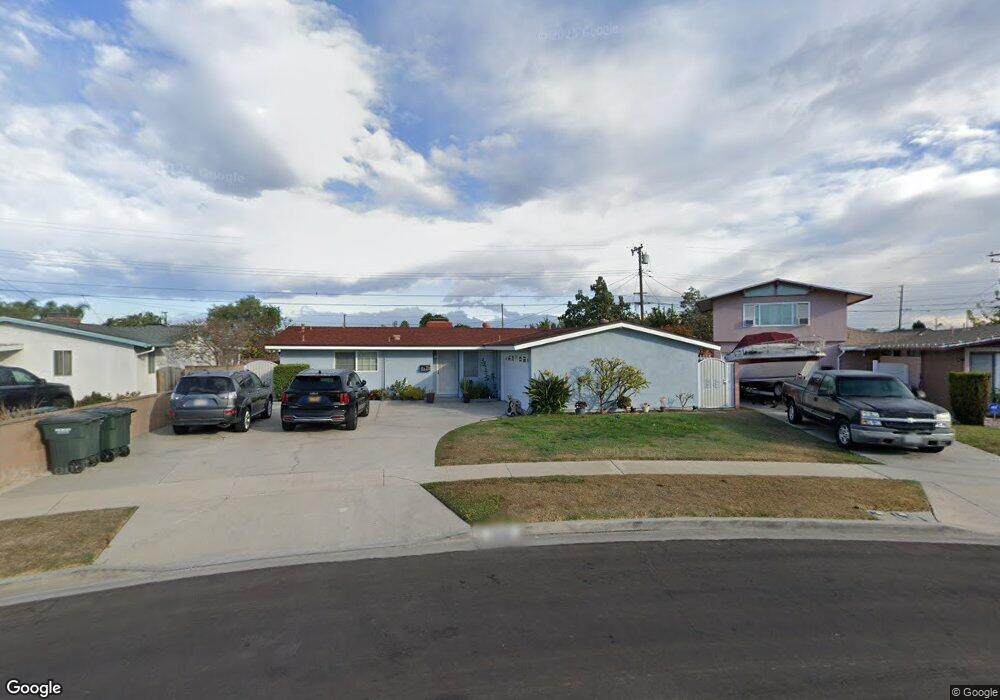
5849 Los Santos Way Buena Park, CA 90620
Estimated Value: $810,758 - $1,080,000
3
Beds
2
Baths
1,192
Sq Ft
$750/Sq Ft
Est. Value
About This Home
This home is located at 5849 Los Santos Way, Buena Park, CA 90620 and is currently estimated at $893,440, approximately $749 per square foot. 5849 Los Santos Way is a home located in Orange County with nearby schools including Steve Luther Elementary School, Walker Junior High School, and John F. Kennedy High School.
Ownership History
Date
Name
Owned For
Owner Type
Purchase Details
Closed on
Oct 19, 2005
Sold by
Villena Apolonia P and Villena Anacleta I
Bought by
Villena Apolonio P and Villena Anacleta I
Current Estimated Value
Purchase Details
Closed on
Feb 25, 2005
Sold by
Villena Apolonino P and Villena Anacleta I
Bought by
Villena Apolonino P and Villena Anacleta I
Home Financials for this Owner
Home Financials are based on the most recent Mortgage that was taken out on this home.
Original Mortgage
$256,000
Outstanding Balance
$74,832
Interest Rate
5.66%
Mortgage Type
New Conventional
Estimated Equity
$818,608
Purchase Details
Closed on
Feb 28, 1996
Sold by
Miyashiro Kirk N
Bought by
Villena Apolonio P and Villena Anacleta I
Home Financials for this Owner
Home Financials are based on the most recent Mortgage that was taken out on this home.
Original Mortgage
$151,841
Interest Rate
7.34%
Mortgage Type
FHA
Create a Home Valuation Report for This Property
The Home Valuation Report is an in-depth analysis detailing your home's value as well as a comparison with similar homes in the area
Home Values in the Area
Average Home Value in this Area
Purchase History
| Date | Buyer | Sale Price | Title Company |
|---|---|---|---|
| Villena Apolonio P | -- | -- | |
| Villena Apolonino P | -- | New Century Title Company | |
| Villena Apolonio P | $155,000 | First American Title Ins Co |
Source: Public Records
Mortgage History
| Date | Status | Borrower | Loan Amount |
|---|---|---|---|
| Open | Villena Apolonino P | $256,000 | |
| Closed | Villena Apolonio P | $151,841 |
Source: Public Records
Tax History Compared to Growth
Tax History
| Year | Tax Paid | Tax Assessment Tax Assessment Total Assessment is a certain percentage of the fair market value that is determined by local assessors to be the total taxable value of land and additions on the property. | Land | Improvement |
|---|---|---|---|---|
| 2025 | $3,055 | $257,317 | $181,718 | $75,599 |
| 2024 | $3,055 | $252,272 | $178,155 | $74,117 |
| 2023 | $2,982 | $247,326 | $174,662 | $72,664 |
| 2022 | $2,942 | $242,477 | $171,237 | $71,240 |
| 2021 | $2,902 | $237,723 | $167,879 | $69,844 |
| 2020 | $2,889 | $235,286 | $166,158 | $69,128 |
| 2019 | $2,812 | $230,673 | $162,900 | $67,773 |
| 2018 | $2,773 | $226,150 | $159,705 | $66,445 |
| 2017 | $2,681 | $221,716 | $156,573 | $65,143 |
| 2016 | $2,657 | $217,369 | $153,503 | $63,866 |
| 2015 | $2,635 | $214,104 | $151,197 | $62,907 |
| 2014 | $2,499 | $209,910 | $148,235 | $61,675 |
Source: Public Records
Map
Nearby Homes
- 5839 Los Santos Way
- 5835 Los Santos Way
- 8623 Valley View St
- 5921 Los Ramos Cir
- 5917 Crescent Ave
- 8757 Los Altos Dr
- 8451 San Clemente Way
- 8456 San Clemente Way
- 5612 Sprague Ave
- 5671 Vonnie Ln
- 5572 Saint Ann Ave
- 5631 Danny Ave
- 5837 Los Arcos Way
- 5493 Twin Lakes Dr
- 5485 Twin Lakes Dr Unit 8
- 5473 Twin Lakes Dr
- 5431 Twin Lakes Dr
- 8011 Rose St
- 5342 La Luna Dr
- 5166 Banbury Cir
- 5845 Los Santos Way
- 5855 Los Santos Way
- 5932 Los Encinos St
- 5944 Los Encinos St
- 5920 Los Encinos St
- 5859 Los Santos Way
- 5956 Los Encinos St
- 5908 Los Encinos St
- 5860 Los Santos Way
- 5865 Los Santos Way
- 5854 Los Santos Way
- 5968 Los Encinos St
- 5896 Los Encinos St
- 5848 Los Santos Way
- 8585 Valley View St
- 5869 Los Santos Way
- 8597 Valley View St
- 8611 Valley View St
- 5829 Los Santos Way
- 5925 Los Encinos St