Estimated Value: $473,000 - $559,000
3
Beds
4
Baths
2,236
Sq Ft
$226/Sq Ft
Est. Value
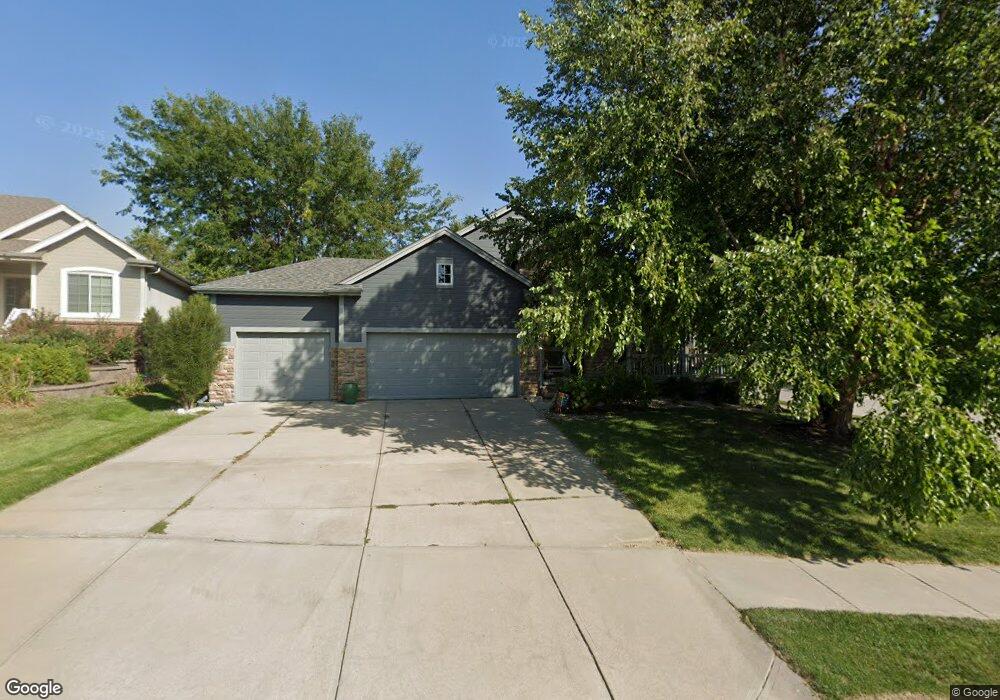
About This Home
This home is located at 585 184, Omaha, NE 68022 and is currently estimated at $505,453, approximately $226 per square foot. 585 184 is a home located in Douglas County with nearby schools including Spring Ridge Elementary School, Elkhorn Ridge Middle School, and Elkhorn South High School.
Ownership History
Date
Name
Owned For
Owner Type
Purchase Details
Closed on
Sep 18, 2018
Sold by
Glorvick Robert John and Glorvick Sheri Jo
Bought by
Betschart Shauna and Smith Allison K
Current Estimated Value
Home Financials for this Owner
Home Financials are based on the most recent Mortgage that was taken out on this home.
Original Mortgage
$268,000
Outstanding Balance
$233,230
Interest Rate
4.5%
Mortgage Type
New Conventional
Estimated Equity
$272,223
Purchase Details
Closed on
Mar 11, 2013
Sold by
Barley Peter M and Barley Tabitha S
Bought by
Glorvick Robert John and Glorvick Sheri Jo
Home Financials for this Owner
Home Financials are based on the most recent Mortgage that was taken out on this home.
Original Mortgage
$228,000
Interest Rate
3.59%
Mortgage Type
New Conventional
Create a Home Valuation Report for This Property
The Home Valuation Report is an in-depth analysis detailing your home's value as well as a comparison with similar homes in the area
Home Values in the Area
Average Home Value in this Area
Purchase History
| Date | Buyer | Sale Price | Title Company |
|---|---|---|---|
| Betschart Shauna | $335,000 | Rts Title & Escrow | |
| Glorvick Robert John | $285,000 | None Available |
Source: Public Records
Mortgage History
| Date | Status | Borrower | Loan Amount |
|---|---|---|---|
| Open | Betschart Shauna | $268,000 | |
| Previous Owner | Glorvick Robert John | $228,000 |
Source: Public Records
Tax History
| Year | Tax Paid | Tax Assessment Tax Assessment Total Assessment is a certain percentage of the fair market value that is determined by local assessors to be the total taxable value of land and additions on the property. | Land | Improvement |
|---|---|---|---|---|
| 2025 | $6,554 | $442,100 | $50,200 | $391,900 |
| 2024 | $8,841 | $408,500 | $50,200 | $358,300 |
| 2023 | $8,841 | $408,500 | $50,200 | $358,300 |
| 2022 | $8,146 | $330,200 | $50,200 | $280,000 |
| 2021 | $8,254 | $330,200 | $50,200 | $280,000 |
| 2020 | $8,340 | $330,200 | $50,200 | $280,000 |
| 2019 | $7,392 | $289,500 | $50,200 | $239,300 |
| 2018 | $7,499 | $289,500 | $50,200 | $239,300 |
| 2016 | $6,748 | $255,100 | $33,000 | $222,100 |
Source: Public Records
Map
Nearby Homes
- 559 S 182nd St
- 18107 Leavenworth St
- 917 S 185th St
- 18713 Jones St
- 18010 Dewey Cir
- 18421 Mason St
- 18612 Mason St
- 18721 Mason St
- 959 S 188th Terrace
- 18911 Leavenworth St
- 18886 Mayberry Plaza
- 822 S 190th Ave
- 826 S 190th Ave
- 1514 S 182nd Cir
- 1808 S 183rd Cir
- 1711 S 181st St
- 2005 S 182nd Avenue Cir
- 19541 Farnam St
- 2107 S 181st Cir
- 19607 Farnam St
Your Personal Tour Guide
Ask me questions while you tour the home.