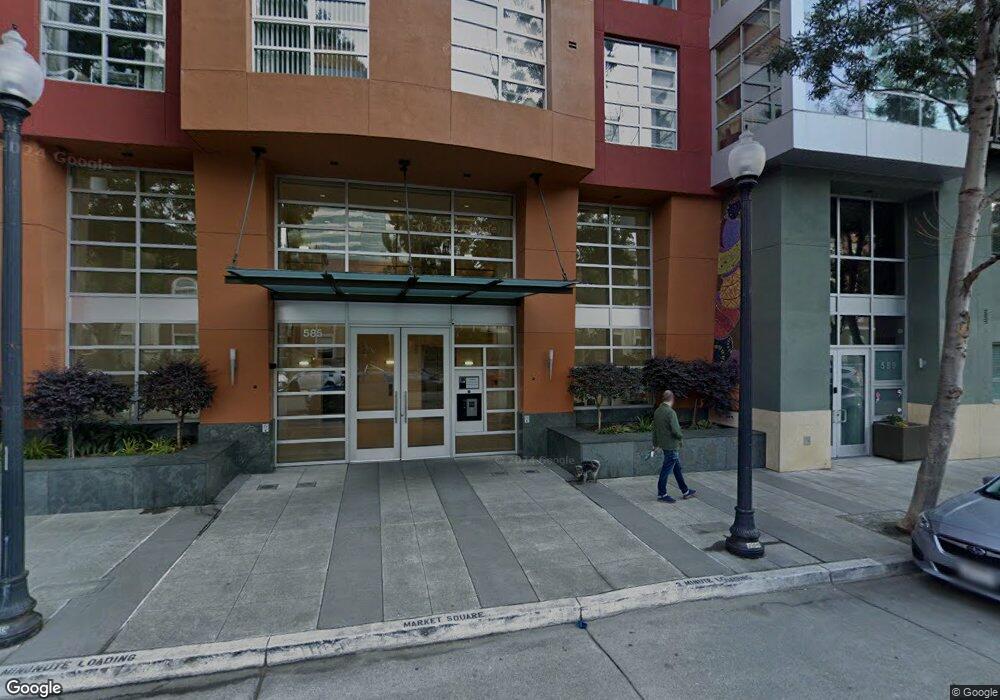
Market Square Homes 585 9th St Unit 413 Oakland, CA 94607
Old Oakland NeighborhoodEstimated Value: $440,000 - $564,000
2
Beds
2
Baths
1,114
Sq Ft
$466/Sq Ft
Est. Value
About This Home
This home is located at 585 9th St Unit 413, Oakland, CA 94607 and is currently estimated at $518,700, approximately $465 per square foot. 585 9th St Unit 413 is a home located in Alameda County with nearby schools including Lincoln Elementary School, Westlake Middle School, and Oakland Technical High School.
Ownership History
Date
Name
Owned For
Owner Type
Purchase Details
Closed on
Apr 20, 2021
Sold by
Miao David and Miao Teresa Teng
Bought by
Miao David and Miao Teresa Teng
Current Estimated Value
Purchase Details
Closed on
Jul 26, 2011
Sold by
Last Mile Properties Llc
Bought by
Teng Miao David and Teng Miao Teresa
Purchase Details
Closed on
Jul 14, 2011
Sold by
Zahn Edward and Zahn Sarah J
Bought by
Last Mile Properties Llc
Purchase Details
Closed on
Jun 6, 2006
Sold by
Housewives Market Llc
Bought by
Zahn Edward and Zahn Sarah J
Home Financials for this Owner
Home Financials are based on the most recent Mortgage that was taken out on this home.
Original Mortgage
$359,049
Interest Rate
6.12%
Mortgage Type
Fannie Mae Freddie Mac
Create a Home Valuation Report for This Property
The Home Valuation Report is an in-depth analysis detailing your home's value as well as a comparison with similar homes in the area
Home Values in the Area
Average Home Value in this Area
Purchase History
| Date | Buyer | Sale Price | Title Company |
|---|---|---|---|
| Miao David | -- | None Available | |
| Teng Miao David | $338,000 | North American Title Company | |
| Last Mile Properties Llc | $217,000 | None Available | |
| Zahn Edward | $449,000 | First American Title Co |
Source: Public Records
Mortgage History
| Date | Status | Borrower | Loan Amount |
|---|---|---|---|
| Previous Owner | Zahn Edward | $359,049 |
Source: Public Records
Tax History Compared to Growth
Tax History
| Year | Tax Paid | Tax Assessment Tax Assessment Total Assessment is a certain percentage of the fair market value that is determined by local assessors to be the total taxable value of land and additions on the property. | Land | Improvement |
|---|---|---|---|---|
| 2025 | $6,954 | $417,524 | $127,357 | $297,167 |
| 2024 | $6,954 | $409,202 | $124,860 | $291,342 |
| 2023 | $7,249 | $408,043 | $122,413 | $285,630 |
| 2022 | $7,028 | $393,042 | $120,012 | $280,030 |
| 2021 | $6,657 | $385,201 | $117,660 | $274,541 |
| 2020 | $6,583 | $388,182 | $116,454 | $271,728 |
| 2019 | $6,295 | $380,574 | $114,172 | $266,402 |
| 2018 | $6,164 | $373,114 | $111,934 | $261,180 |
| 2017 | $5,912 | $365,800 | $109,740 | $256,060 |
| 2016 | $5,679 | $358,627 | $107,588 | $251,039 |
| 2015 | $5,646 | $353,243 | $105,973 | $247,270 |
| 2014 | $5,673 | $346,324 | $103,897 | $242,427 |
Source: Public Records
About Market Square Homes
Map
Nearby Homes
- 585 9th St Unit 556
- 585 9th St Unit 422
- 801 Clay St Unit 801
- 555 10th St Unit 102
- 555 10th St Unit 113
- 555 10th St Unit 201
- 555 10th St Unit 315
- 901 Jefferson St Unit 406
- 667 10th St
- 675 8th St Unit 15
- 485 8th St Unit 402
- 686 10th St Unit 6
- 655 12th St Unit 205
- 655 12th St Unit 311
- 655 12th St Unit 220
- 1495 5th St
- 801 Franklin St Unit 819
- 801 Franklin St Unit 205
- 801 Franklin St Unit 902
- 423 7th St Unit 105
- 585 9th St
- 585 9th St
- 585 9th St Unit 353
- 585 9th St Unit 332
- 585 9th St Unit 552
- 585 9th St Unit 650
- 585 9th St Unit 656
- 585 9th St Unit 636
- 585 9th St Unit 632
- 585 9th St Unit 630
- 585 9th St Unit 631
- 585 9th St Unit 633
- 585 9th St Unit 635
- 585 9th St Unit 639
- 585 9th St Unit 641
- 585 9th St Unit 643
- 585 9th St Unit 645
- 585 9th St Unit 649
- 585 9th St Unit 651
- 585 9th St Unit 653