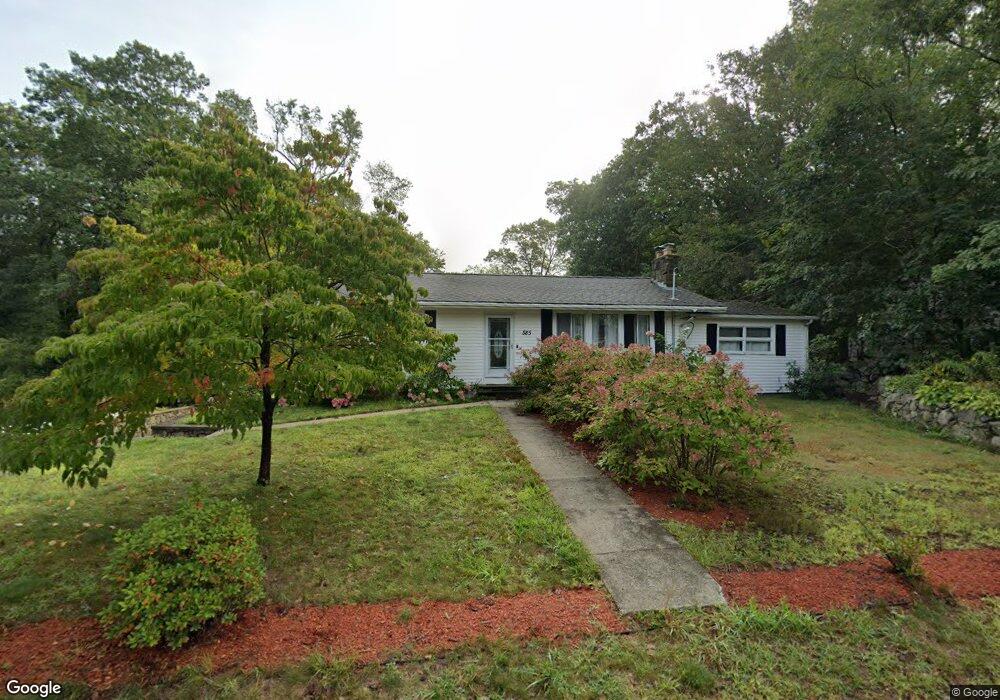
585 Blackrock Rd Coventry, RI 02816
Estimated Value: $425,102 - $505,000
2
Beds
1
Bath
1,344
Sq Ft
$350/Sq Ft
Est. Value
About This Home
This home is located at 585 Blackrock Rd, Coventry, RI 02816 and is currently estimated at $471,026, approximately $350 per square foot. 585 Blackrock Rd is a home located in Kent County with nearby schools including Alan Shawn Feinstein Ms Of Cov, Coventry High School, and St Joseph School.
Ownership History
Date
Name
Owned For
Owner Type
Purchase Details
Closed on
Sep 26, 2008
Sold by
Us Bank Na
Bought by
Benz Heather J
Current Estimated Value
Purchase Details
Closed on
Sep 9, 2008
Sold by
Us Bank Na
Bought by
Casavant Michael D and Casavant Louisa
Purchase Details
Closed on
Nov 30, 2004
Sold by
Frappier Dennis A and Frappier Tracy L
Bought by
Casavant Michael D and Casavant Louisa
Purchase Details
Closed on
Sep 11, 1997
Sold by
Kraemer Maureen L
Bought by
Frappier Dennis A and Frappier Tracy
Create a Home Valuation Report for This Property
The Home Valuation Report is an in-depth analysis detailing your home's value as well as a comparison with similar homes in the area
Purchase History
| Date | Buyer | Sale Price | Title Company |
|---|---|---|---|
| Benz Heather J | $154,900 | -- | |
| Casavant Michael D | $198,000 | -- | |
| Casavant Michael D | $280,000 | -- | |
| Frappier Dennis A | $110,500 | -- |
Source: Public Records
Mortgage History
| Date | Status | Borrower | Loan Amount |
|---|---|---|---|
| Open | Frappier Dennis A | $34,600 | |
| Open | Frappier Dennis A | $148,344 |
Source: Public Records
Tax History
| Year | Tax Paid | Tax Assessment Tax Assessment Total Assessment is a certain percentage of the fair market value that is determined by local assessors to be the total taxable value of land and additions on the property. | Land | Improvement |
|---|---|---|---|---|
| 2025 | $5,195 | $322,900 | $122,800 | $200,100 |
| 2024 | $5,115 | $322,900 | $122,800 | $200,100 |
| 2023 | $4,950 | $322,900 | $122,800 | $200,100 |
| 2022 | $4,869 | $248,800 | $117,100 | $131,700 |
| 2021 | $4,827 | $248,800 | $117,100 | $131,700 |
| 2020 | $5,533 | $248,800 | $117,100 | $131,700 |
| 2019 | $4,326 | $194,500 | $82,100 | $112,400 |
| 2018 | $4,203 | $194,500 | $82,100 | $112,400 |
| 2017 | $4,081 | $194,500 | $82,100 | $112,400 |
| 2016 | $4,924 | $230,000 | $128,300 | $101,700 |
| 2015 | $4,791 | $230,000 | $128,300 | $101,700 |
| 2014 | $4,691 | $230,000 | $128,300 | $101,700 |
| 2013 | $4,592 | $246,100 | $126,300 | $119,800 |
Source: Public Records
Map
Nearby Homes
- 591 Blackrock Rd
- 594 Blackrock Rd
- 575 Blackrock Rd
- 601 Blackrock Rd
- 554 Blackrock Rd
- 600 Blackrock Rd
- 544 Blackrock Rd
- 607 Blackrock Rd
- 606 Blackrock Rd
- 3 Partridge Dr
- 5 Partridge Dr
- 535 Blackrock Rd
- 351 Hill St
- 1 Partridge Dr
- 610 Blackrock Rd
- 371 Hill St
- 0 Manning Ct
- 12 Hawthorne Rd
- 524 Blackrock Rd
- 7 Partridge Dr
Your Personal Tour Guide
Ask me questions while you tour the home.