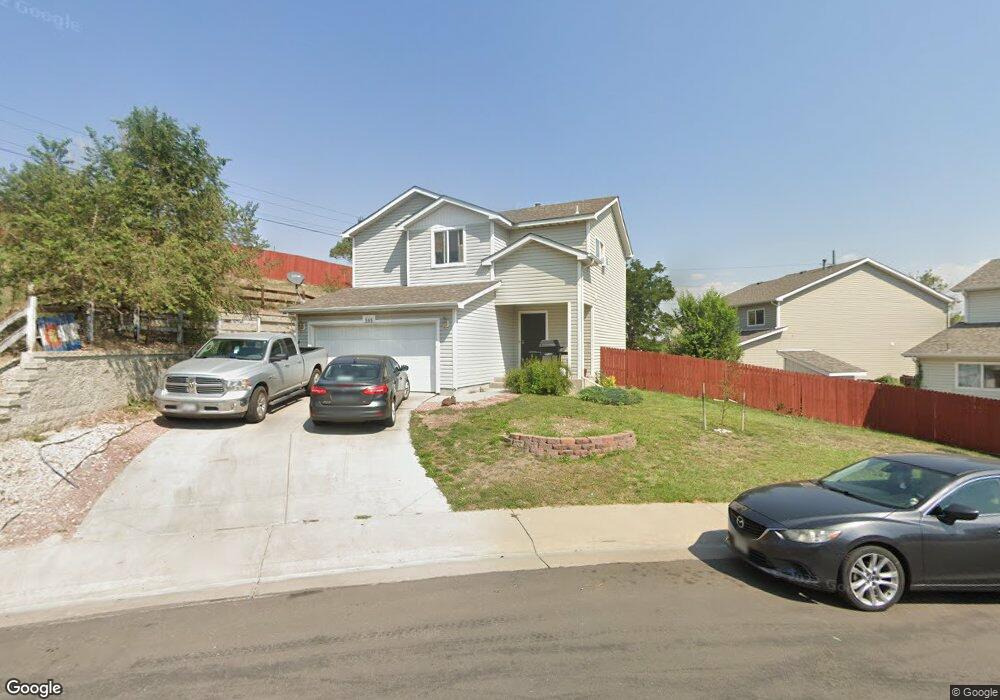
585 E 78th Dr Denver, CO 80229
Welby NeighborhoodEstimated Value: $430,000 - $478,000
3
Beds
3
Baths
1,420
Sq Ft
$319/Sq Ft
Est. Value
About This Home
This home is located at 585 E 78th Dr, Denver, CO 80229 and is currently estimated at $452,554, approximately $318 per square foot. 585 E 78th Dr is a home located in Adams County with nearby schools including Trailside Academy, The Pinnacle Charter School High School, and The Pinnacle Charter School Elementary.
Ownership History
Date
Name
Owned For
Owner Type
Purchase Details
Closed on
Jan 15, 2014
Sold by
Nguyen Khanh
Bought by
Th Property Rental Llc
Current Estimated Value
Purchase Details
Closed on
Jan 24, 2012
Sold by
Nguyen Thao
Bought by
Nguyen Khanh
Purchase Details
Closed on
Sep 12, 2008
Sold by
Macias Luis E
Bought by
Nguyen Thao
Purchase Details
Closed on
Jul 27, 2004
Sold by
Macias Luis E and Gonzalez Jaime
Bought by
Macias Luis E
Home Financials for this Owner
Home Financials are based on the most recent Mortgage that was taken out on this home.
Original Mortgage
$160,000
Interest Rate
5.88%
Mortgage Type
Purchase Money Mortgage
Purchase Details
Closed on
Feb 11, 2002
Sold by
Kb Home Colorado Inc
Bought by
Macias Luis E and Gonzalez Jaime
Home Financials for this Owner
Home Financials are based on the most recent Mortgage that was taken out on this home.
Original Mortgage
$166,046
Interest Rate
7.05%
Mortgage Type
FHA
Create a Home Valuation Report for This Property
The Home Valuation Report is an in-depth analysis detailing your home's value as well as a comparison with similar homes in the area
Home Values in the Area
Average Home Value in this Area
Purchase History
| Date | Buyer | Sale Price | Title Company |
|---|---|---|---|
| Th Property Rental Llc | -- | None Available | |
| Nguyen Khanh | -- | None Available | |
| Nguyen Thao | $152,000 | Title America | |
| Macias Luis E | -- | Infinity Title Llc | |
| Macias Luis E | $168,477 | -- |
Source: Public Records
Mortgage History
| Date | Status | Borrower | Loan Amount |
|---|---|---|---|
| Previous Owner | Macias Luis E | $160,000 | |
| Previous Owner | Macias Luis E | $166,046 |
Source: Public Records
Tax History
| Year | Tax Paid | Tax Assessment Tax Assessment Total Assessment is a certain percentage of the fair market value that is determined by local assessors to be the total taxable value of land and additions on the property. | Land | Improvement |
|---|---|---|---|---|
| 2025 | $2,939 | $29,990 | $6,460 | $23,530 |
| 2024 | $2,939 | $27,570 | $5,940 | $21,630 |
| 2023 | $2,920 | $32,610 | $6,090 | $26,520 |
| 2022 | $2,744 | $25,450 | $5,910 | $19,540 |
| 2021 | $2,584 | $25,450 | $5,910 | $19,540 |
| 2020 | $2,486 | $24,780 | $6,080 | $18,700 |
| 2019 | $2,496 | $24,780 | $6,080 | $18,700 |
| 2018 | $2,020 | $18,930 | $5,180 | $13,750 |
| 2017 | $1,984 | $18,930 | $5,180 | $13,750 |
| 2016 | $1,507 | $14,090 | $3,020 | $11,070 |
| 2015 | $1,332 | $14,090 | $3,020 | $11,070 |
| 2014 | -- | $11,660 | $2,390 | $9,270 |
Source: Public Records
Map
Nearby Homes
- 855 E 78th Ave Unit 30
- 875 E 78th Ave Unit 39
- 875 E 78th Ave Unit 21
- 875 E 78th Ave Unit 69
- 875 E 78th Ave Unit 9-68
- 875 E 78th Ave Unit 40
- 875 E 78th Ave Unit 68
- 875 E 78th Ave Unit 7
- 875 E 78th Ave Unit 9-69
- 7840 Ogden Ct
- 7839 Mona Ct
- 8148 Washington St Unit 179
- 8184 Washington St Unit 121
- 8037 Sherman Way
- 1020 Coronado Pkwy S Unit B
- 8176 Washington St Unit 113
- 952 Coronado Pkwy S Unit C
- 8137 Lafayette St
- 8128 Lafayette St
- 8260 Washington St Unit 78
- 620 E 78th Place
- 625 E 78th Ave
- 600 E 78th Place
- 605 E 78th Ave
- 582 E 78th Dr
- 645 E 78th Ave
- 640 E 78th Place
- 580 E 78th Place
- 562 E 78th Dr
- 665 E 78th Ave
- 581 E 77th Ave
- 660 E 78th Place
- 560 E 78th Place
- 561 E 77th Dr
- 685 E 78th Ave
- 7857 Pearl St
- 7856 Pennsylvania St
- 522 E 78th Dr
- 541 E 77th Dr
- 540 E 78th Place
Your Personal Tour Guide
Ask me questions while you tour the home.